LunarWeave
The Debt Staircase Is Real. It Is Not A G7 Law.
When the head of the International Monetary Fund tells rich countries to stop borrowing, the warning is easy to hear as a verdict on an entire club. In a BBC interview, Kristalina Georgieva said global shocks had pushed debt “up like a staircase not to heaven,” and that advanced economies including the United States and the United Kingdom need to cut borrowing as interest costs rise.
The staircase is a fair description of what happened after 2008 and again in 2020. It is not a description of every large rich economy. In the IMF’s own books, Germany walked back down between crises. France is the only G7 member whose debt ratio in 2025 sits above its 2020 spike. The United States never closed a budget hole that the Fund still puts near 7 percent of GDP — which is why the next step, in this snapshot, is mostly an American forecast.
Two risers, then a split
The IMF’s general government gross debt series measures the whole public sector as a share of GDP — central government plus states, localities and social security, not the US federal debt number that dominates American politics. Readers need to pick the country in that chart; the figures below are from a pinned World Economic Outlook snapshot, not a live webpage.
From 2007, the last pre-crisis year, to 2025, that ratio rose 58.9 percentage points in the United States (64.9 to 123.9 percent of GDP) and 59.3 points in the United Kingdom (43.0 to 102.3). France was close behind, up 50.5 points to 116.0 percent. Japan added 56.1 points from an already high base, to 206.5 percent. Canada rose 46.3 points; Italy 33.6.
Germany is the exception that makes the metaphor work as a warning rather than a law of nature. Its debt ratio was 63.7 percent of GDP in 2007 and 62.9 percent in 2025.
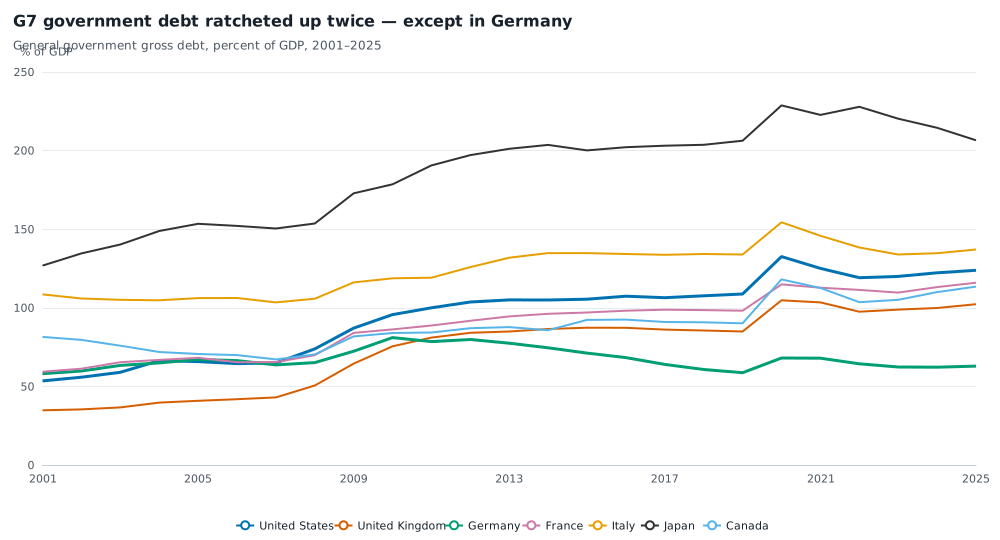
General government gross debt as a percent of GDP, G7 members, 2001–2025. Source: IMF World Economic Outlook. 2025 is an IMF estimate in the pinned August 2026 snapshot. A falling ratio is not the same as paying down the debt stock.
The first riser is the global financial crisis. The second is the pandemic. What happened between those landings is the part the staircase image usually skips.
Germany’s ratio peaked at 81.0 percent of GDP in 2010, then fell 22.3 points to 58.7 percent by 2019 — below where it had stood in 2007. That was not just a booming denominator. The IMF records general government net lending surpluses in Germany in every year from 2013 through 2019.
The United States did the opposite. Its ratio kept drifting up after the crisis, from 103.7 percent in 2012 to 108.8 percent in 2019, before the pandemic took it to 132.6 percent in 2020. The United Kingdom plateaued near 85 percent. France kept climbing, from 65.5 percent in 2007 to 98.2 percent on the eve of COVID.
After the second step, most ratios came off the peak
If the staircase were still being built every year, 2025 would be a new high almost everywhere. It is not.
France is the only G7 member whose 2025 debt ratio, 116.0 percent of GDP, exceeds its 2020 reading of 114.9 percent. Italy is 17.3 points below 2020. Japan is 22.2 points below. The United States is 8.7 points below its 2020 spike — and still 15.1 points above 2019.
That last comparison is the one that matters for a shock that has already receded. Coming off a wartime or pandemic peak is not the same as unwinding the step. The US, UK, French and Canadian ratios remain far above their 2007 levels. Germany’s does not.
A falling debt-to-GDP ratio also should not be read as a paid-off loan. Japan’s 2025 ratio is much lower than in 2020 even though Tokyo is still estimated to be running a 1.1 percent-of-GDP deficit. Nominal GDP growth and other stock-flow effects can shrink the ratio while new borrowing continues.
The live problem is the hole that never closed
Georgieva’s operational point was not the 2020 spike. It was that advanced economies should cut borrowing now, with interest costs rising. On that narrower test, the G7 is not a single patient.
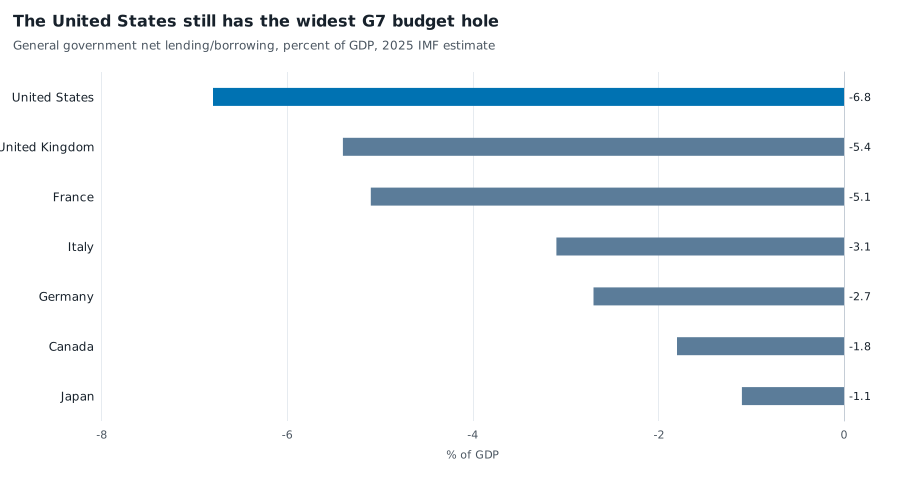
General government net lending/borrowing as a percent of GDP, 2025 IMF estimate. Negative values are deficits. Source: IMF World Economic Outlook. This is the general-government balance, not the US federal budget alone.
In 2025 the IMF’s estimate of net lending/borrowing is −6.8 percent of GDP in the United States, the widest G7 deficit, against −5.4 percent in the United Kingdom, −5.1 percent in France, −3.1 percent in Italy, −2.7 percent in Germany, −1.8 percent in Canada and −1.1 percent in Japan.
The American hole is not a mystery of pandemic hangover alone. US general-government revenue was 30.9 percent of GDP in 2025 — 17 points below Germany’s 47.9 percent and more than 21 points below France’s 52.4 percent. US expenditure was 37.7 percent of GDP, still 1.9 points above 2019. A relatively small public sector is running a large rich-country deficit because it collects so little, not because it spends like France.
That combination is why the Fund’s projections, in this snapshot, still build another US step. They take US debt from 123.9 percent of GDP in 2025 to 142.1 percent in 2031, an 18.2 point rise, the largest in the G7. France is up another 4.7 points. Germany is projected to climb 10.7 points — a real increase, but from 62.9 percent, not from 124. The United Kingdom is essentially flat. Canada and Japan are projected to keep falling.
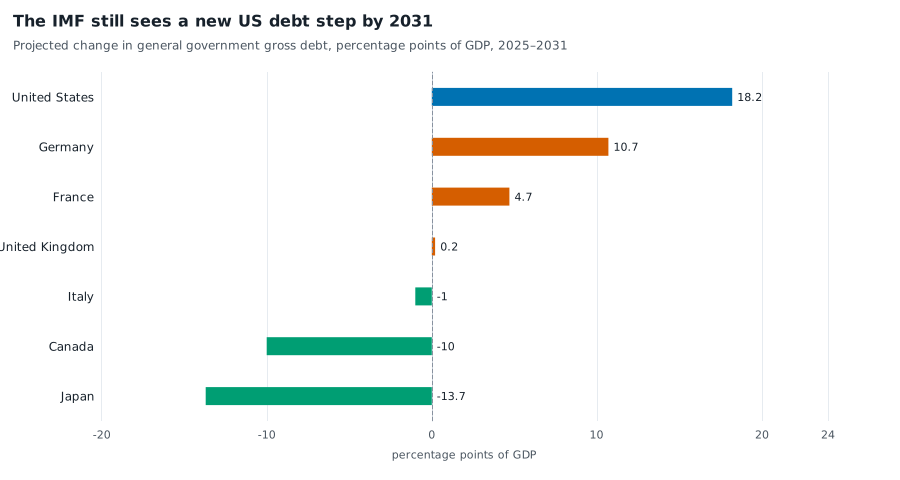
Projected change in general government gross debt as a share of GDP, 2025 to 2031, in percentage points. Source: IMF World Economic Outlook. These are projections in the pinned snapshot, not realized outcomes.
| Country | 2007 | 2019 | 2020 | 2025 | 2031 proj. | 2007–25 | 2025–31 |
|---|---|---|---|---|---|---|---|
| United States | 64.9 | 108.8 | 132.6 | 123.9 | 142.1 | +58.9 | +18.2 |
| United Kingdom | 43.0 | 84.9 | 104.8 | 102.3 | 102.6 | +59.3 | +0.2 |
| Germany | 63.7 | 58.7 | 68.0 | 62.9 | 73.7 | −0.8 | +10.7 |
| France | 65.5 | 98.2 | 114.9 | 116.0 | 120.7 | +50.5 | +4.7 |
| Italy | 103.5 | 133.9 | 154.4 | 137.1 | 136.1 | +33.6 | −1.0 |
| Japan | 150.4 | 206.3 | 228.8 | 206.5 | 192.8 | +56.1 | −13.7 |
| Canada | 67.2 | 90.1 | 118.1 | 113.5 | 103.5 | +46.3 | −10.0 |
IMF World Economic Outlook, general government gross debt, percent of GDP. 2025 is an estimate in this snapshot; 2031 is a projection. Totals may not sum from rounded cells.
What the warning actually fits
Georgieva is right that large rich countries ratcheted debt up in two crises and, in several cases, did not walk back down in between. She is not describing a uniform G7. Germany used surplus years in the 2010s to reverse the first step. Most of the group has come off the 2020 peak without returning to 2007. France is still making new highs. The United States is the member whose deficit remains wide enough that the IMF’s own forecast pours another flight of stairs.
That is the part of the warning that will still be true if the next shock arrives before the hole closes. A 7 percent-of-GDP deficit at 124 percent debt is a different starting point from a 7 percent deficit at 65 percent debt. The staircase image captures the first comparison. It does not capture the country that already turned around on the landing.
Sources and methods
This is retrospective research, written on 24 September 2026 about reporting from 23 September 2026. It uses a pinned IMF World Economic Outlook snapshot ingested on 10 August 2026 and normalized on 24 August 2026, not whatever the Fund later revises. Observation years are not release dates. Treat 2025 figures as IMF estimates in this snapshot and 2026–2031 as projections.
Debt is general government gross debt as a percent of GDP (WEO code GGXWDG_NGDP). The budget balance is general government net lending/borrowing as a percent of GDP (GGXCNL_NGDP). Revenue and expenditure are the matching general-government shares of GDP. The United States has no 2000 debt observation in this extract; comparisons that need a pre-crisis year use 2007. Missing years are omitted, not treated as zero.
Official methodology and the underlying dataset are published with the IMF World Economic Outlook. Charts were rendered locally from the saved extracts; SVG rendering is not a browser or mobile layout check.
Research Date
The displayed date matches the related news edition. Research was completed 2026-09-24.
Related news: Daily · 2026-09-23
More Research
Bangladesh’s Factories Are Short Of Power Because The Grid Still Runs On Gas And Oil
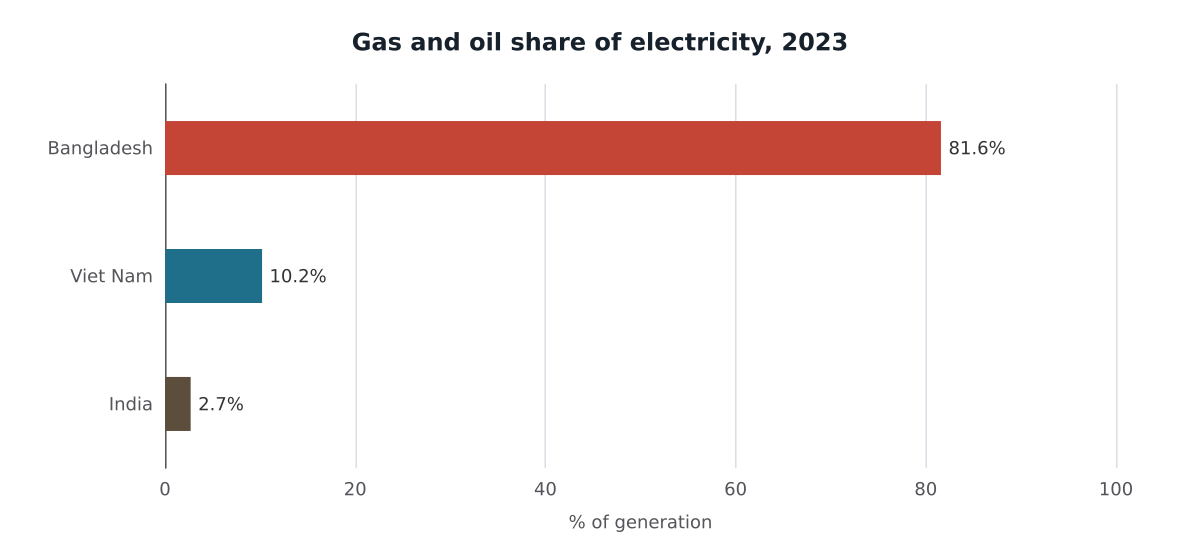
In 2023, gas and oil generated 81.6% of Bangladesh’s electricity, versus 10.2% in Viet Nam, after national generation had already stalled.
The Diesel Crunch Is Landing On A Much Smaller US Refining Workforce
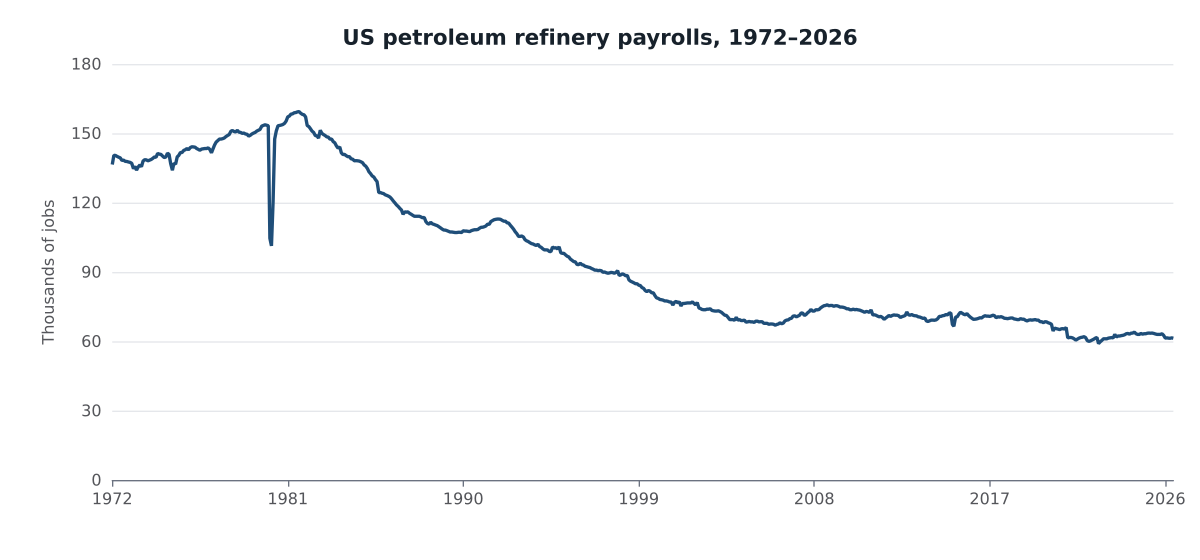
US petroleum refineries employed 61,300 people in June 2026, 61.5 percent below the 1981 peak, as diesel prices were reported at records.
Ireland’s 26 Percent Tax State Now Collects More Per Person Than France
Ireland’s general-government revenue is a much smaller share of GDP than France’s, but in 2024 it still collected more dollars per resident.