LunarWeave
Bangladesh’s Factories Are Short Of Power Because The Grid Still Runs On Gas And Oil
When a Middle East energy shock hits a garment industry, the damage depends on what the lights actually run on. In September 2026, Dawn reported that gas and power shortages had already forced most Bangladeshi knitwear factories to cut production, after fuel prices rose and shipping costs jumped. One Dhaka-area supplier to Walmart, Gap and Next kept sewing because it makes much of its own electricity, including from rooftop solar. Dawn described that factory as an exception.
The exception is the point. Official generation data cannot yet measure this autumn’s outages. They can show the system those outages landed on. In 2023, the latest year in the International Renewable Energy Agency statistics used here, natural gas and oil together produced 81.6% of Bangladesh’s electricity. Renewables produced 2.1%. Viet Nam, the main rival exporter, generated only 10.2% of its power from gas and oil that year.
Four-fifths of the power is still a fuel cargo
Bangladesh generated 94.2 TWh in 2023. Of that, natural gas supplied 63.4%, oil 18.1% and coal 16.4%. Solar photovoltaic was 1.3% of generation; hydropower 0.8%. IRENA’s own renewable-share series puts renewables at 2.08%, matching the 2.1% obtained by dividing total renewable generation by the national total.
That mix is not a rounding error in a diversified system. It is a grid whose output still moves when gas fields, LNG cargoes or diesel shipments do.
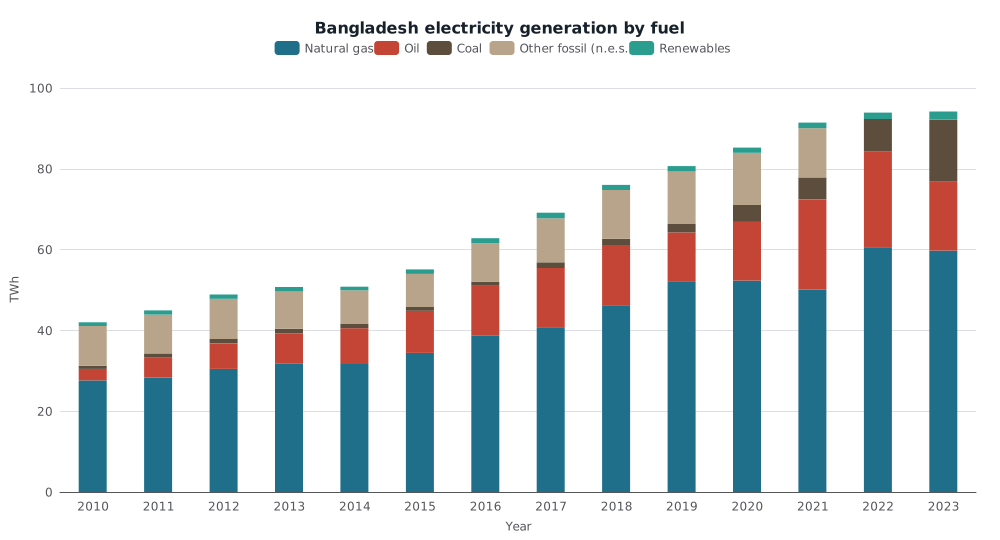
Annual electricity generation in terawatt-hours, 2010–2023. Totals are IRENA all-grid non-renewable plus renewable generation. “Other fossil (n.e.s.)” is IRENA’s not-elsewhere-specified fossil series, observed for 2010–2021; in 2022–2023 that series has no rows and labelled gas, oil and coal already equal total non-renewable generation. Source: IRENA Renewable Energy Statistics.
The 2023 snapshot is more complete than the early 2010s. Through 2021, IRENA still recorded a large “fossil fuels not elsewhere specified” residual — 23.4% of generation in 2010. That block should not be treated as zero, and it should not be assigned to gas. By 2022 it had been allocated. The clean comparison is therefore 2023, not a story that gas “rose” from an under-classified past.
What 2023 does show is a system that had already stopped growing. Generation rose at a 7.5% average annual rate from 2010 to 2019, then 3.9% a year from 2019 to 2023. Between 2022 and 2023 the total barely moved: 93.9 TWh to 94.2 TWh, up 0.3%. Gas output slipped 1.4%. Oil output fell 28%. Coal almost doubled, up 90%, as on-grid coal capacity jumped from 2.7 GW to 6.0 GW. The substitute for missing oil was more coal, not a renewable build-out.
On-grid capacity still leans on the same fuels: 11.7 GW of gas and 7.0 GW of oil in 2023, against that newly enlarged coal fleet. Capacity is not generation, and on-grid capacity is not a complete picture of off-grid industrial plants. It is enough to show where the country had been adding megawatts.
The rival exporter is not on the same fuels
Viet Nam generated 268 TWh in 2023. Gas and oil were 10.2% of that total — 10.0% gas and 0.2% oil. Coal and renewables each supplied about 45%. India, a much larger grid, generated only 2.7% of its electricity from gas and oil.
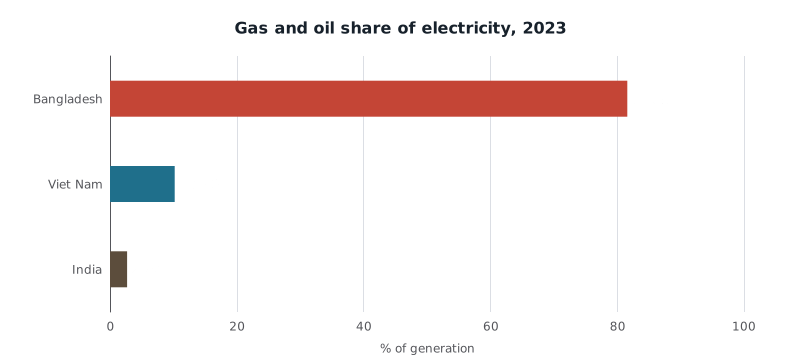
Share of 2023 electricity generation from natural gas plus oil. Denominator is total non-renewable plus total renewable generation. Pakistan and Cambodia are omitted because their 2023 gas series were empty. Source: IRENA.
| 2023 share of generation | Bangladesh | Viet Nam | India |
|---|---|---|---|
| Gas plus oil | 81.6% | 10.2% | 2.7% |
| Renewables | 2.1% | 44.9% | 19.9% |
A Middle East fuel shock can raise costs everywhere. It does not hit every garment exporter’s power system the same way. Bangladesh’s factories are competing with a neighbour whose electricity mix is mostly coal and renewables, not pipeline gas and furnace oil.
This is not a claim that Viet Nam has cheap, clean or unconstrained power. Coal is still about 45% of its 2023 generation. It is a claim about exposure: 81.6% versus 10.2% is the difference between a grid that is mostly a fuel market and a grid that is not.
The slowdown started before this autumn’s outages
The garment crunch is landing on an economy that had already lost altitude. In the IMF World Economic Outlook snapshot used here, Bangladesh’s constant-price GDP growth slowed from 7.1% in 2022 to 5.8% in 2023 and 4.2% in 2024. The Fund’s 2025 projection is 3.5% — the weakest year in this series since the 3.4% pandemic print in 2020. Viet Nam’s 2024 growth was 7.0%, with 8.0% projected for 2025. Readers need to choose Bangladesh or Viet Nam in that chart; the page does not pre-select a country.
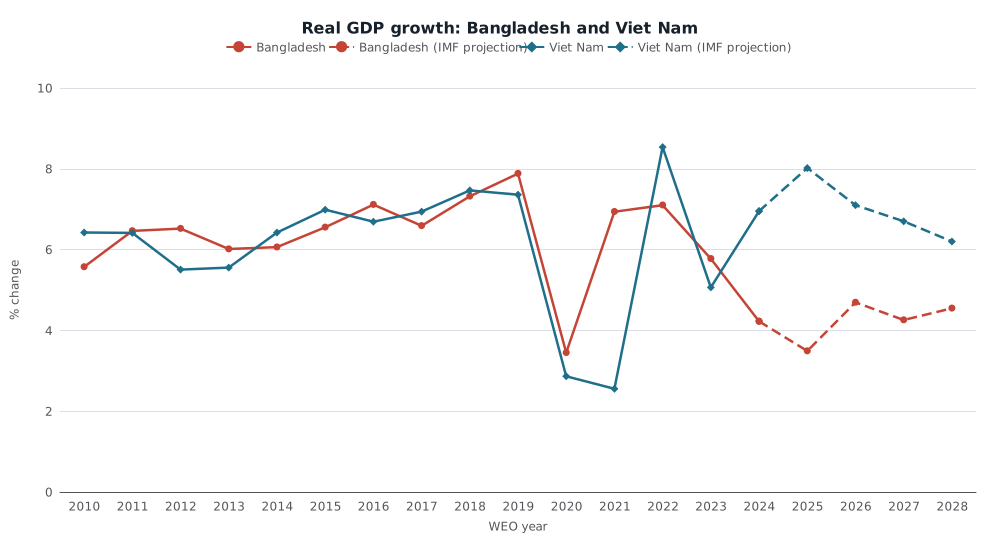
IMF World Economic Outlook constant-price GDP percent change. Solid lines are 2010–2024; dashed lines are 2025–2028 projections in the August 2026 snapshot. Bangladesh is reported on a fiscal-year basis. Source: IMF WEO.
Prices moved the other way. Average consumer-price inflation rose from 6.1% in 2022 to 9.7% in 2024, with 10.0% projected for 2025; choose Bangladesh in that chart. The current-account deficit narrowed from 4.0% of GDP in 2022 to 1.4% in 2024, so the slowdown is not a widening external gap in these figures. Dollar GDP even slipped from $460 billion in 2022 to $450 billion in 2024, a currency and price effect, not a measure of real output.
None of those IMF series is a factory electricity meter. They do show that Bangladesh entered 2026 with slower real growth, higher inflation and a power system that had already ceased to expand. Dawn’s reported order cancellations sit on top of that, not in place of it.
What the figures cannot say
IRENA’s generation file ends in 2023. It cannot confirm how many hours factories lost in August and September 2026, whether LNG cargoes arrived, or whether the knitwear survey Dawn cited is representative. Empty series are not zeros: Pakistan and Cambodia are left out of the fuel-share comparison for that reason. Nuclear generation for Bangladesh is also empty in this extract, and is not treated as zero.
The IMF figures for 2025–2028 are projections in an August 2026 vintage. They are not observations of this autumn’s shutdowns, and Bangladesh’s WEO growth rates are fiscal-year numbers. A fuel-heavy grid makes a Middle East energy shock more dangerous. It does not, by itself, prove that Hormuz caused the 2024 slowdown or that rooftop solar can replace 82% of national generation.
The practical conclusion is narrower, and harder. Bangladesh’s garment industry is being asked to keep global clothing shelves stocked from a power system that, as of the last complete official year, still burned gas and oil for more than four-fifths of its electricity — after total generation had already stalled.
Sources and methods
This is retrospective research completed on 23 September 2026, using pinned IRENA and IMF snapshots available at research time, not an as-of reconstruction of what was knowable on 22 September 2026. Generation is IRENA all-grid electricity in GWh; totals are total non-renewable plus total renewable generation. Capacity figures are on-grid megawatts only. IMF growth, inflation and the current account are annual World Economic Outlook series; 2025–2028 are projections. Calculations are in analysis/calculate.py from saved extracts.
Research Date
The displayed date matches the related news edition. Research was completed 2026-09-23.
Related news: Daily · 2026-09-22
More Research
The Debt Staircase Is Real. It Is Not A G7 Law.
IMF general-government accounts show the post-2008 and post-2020 debt staircase in the United States, Britain and France — and a German exception that walked back down.
The Diesel Crunch Is Landing On A Much Smaller US Refining Workforce
US petroleum refineries employed 61,300 people in June 2026, 61.5 percent below the 1981 peak, as diesel prices were reported at records.
Ireland’s 26 Percent Tax State Now Collects More Per Person Than France
Ireland’s general-government revenue is a much smaller share of GDP than France’s, but in 2024 it still collected more dollars per resident.