LunarWeave
Europe’s Oil Shock Is Back. Its Inflation Crisis Is Not.
A reported 3 percent inflation print in Europe, arriving with crude above $106 a barrel and a stalled fight over the Strait of Hormuz, is easy to read as 2022 all over again. That earlier energy shock pushed annual consumer-price inflation in Germany, Italy and Spain above 8 percent. Households felt it in heating bills and supermarket receipts; central banks spent the next two years undoing it.
The International Monetary Fund’s annual average consumer-price inflation accounts say the sequel, so far, is much smaller. In the four largest euro-area economies, inflation had already fallen back toward — and in France below — 2 percent by 2025. The Fund’s 2026 projections are a modest rebound, not a second crisis: 1.8 to 3.0 percent, depending on the country. That is the neighbourhood of a 3 percent monthly print, not of 2022.
This piece uses the IMF’s World Economic Outlook annual averages. It cannot confirm or refute a single month’s flash estimate. What it can do is show whether the large euro-area economies have actually returned to their energy-crisis inflation rates, and whether the Fund’s own oil and European gas prices look like 2022.
2022 was not a slightly bad year
In the WEO, annual average consumer-price inflation in 2022 reached 8.75 percent in Italy, 8.67 percent in Germany, 8.32 percent in Spain and 5.9 percent in France. For each country that was the highest annual rate in the 2000–2020 window. The previous peaks were all in 2008: 3.51 percent in Italy, 2.76 percent in Germany, 4.13 percent in Spain and 3.16 percent in France.
By 2025 those annual rates had fallen to 0.93 percent in France, 1.63 percent in Italy, 2.3 percent in Germany and 2.69 percent in Spain. The drop from 2022 was between five and seven percentage points in every case except France, which had the mildest 2022 peak and still cut its rate by five points.
The Fund’s 2026 projections then tick back up: 1.84 percent in France, 2.64 percent in Italy, 2.65 percent in Germany and 3.04 percent in Spain. Spain is the only one of the four above 3 percent. All four remain below their own 2008 annual rates. None is within shouting distance of 2022.
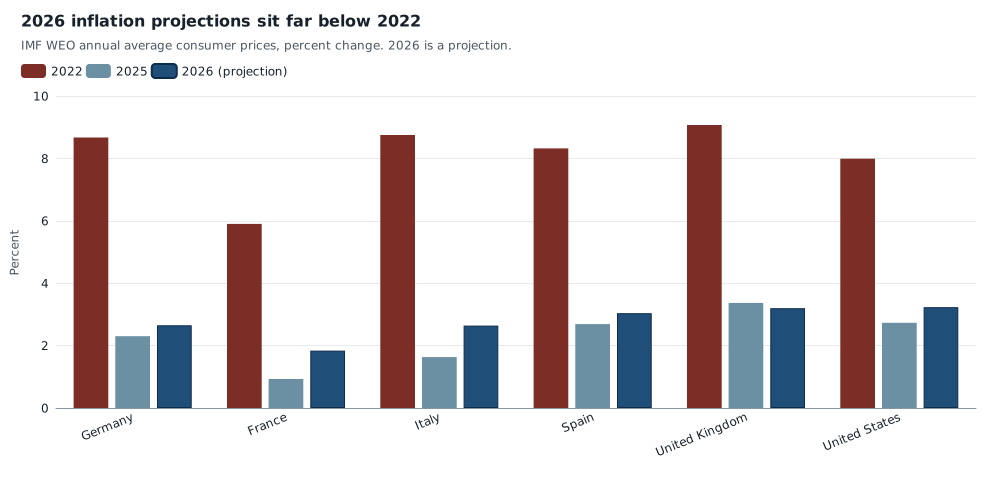
Annual average consumer-price inflation, percent change. 2022 and 2025 are historical/estimated annual rates in this WEO snapshot; 2026 is a projection. This is not a monthly print. Source: IMF World Economic Outlook (PCPIPCH).
The same 3 percent neighbourhood appears outside the euro area. The Fund projects 3.2 percent in the United Kingdom in 2026, after 3.37 percent in 2025 and 9.07 percent in 2022, and 3.23 percent in the United States, after 2.73 percent and 7.99 percent. Britain’s 2026 figure is a slight decline from 2025, not a surge. Both countries stay well below their 2000–2020 highs (4.46 percent in the United Kingdom in 2011; 3.81 percent in the United States in 2008).
| Country | 2022 | 2025 | 2026 projection |
|---|---|---|---|
| Germany | 8.67 | 2.3 | 2.65 |
| France | 5.9 | 0.93 | 1.84 |
| Italy | 8.75 | 1.63 | 2.64 |
| Spain | 8.32 | 2.69 | 3.04 |
| United Kingdom | 9.07 | 3.37 | 3.2 |
| United States | 7.99 | 2.73 | 3.23 |
Figures are IMF annual average consumer-price inflation, percent change. 2026 is a projection in this snapshot.
A 3 percent monthly reading in Europe would therefore be news about a bounce, not about a return to the crisis peak. It would also be uneven. France’s 2026 projection is still below 2 percent; Spain’s is just above 3 percent. Treating “Europe” as a single inflation story erases that spread.
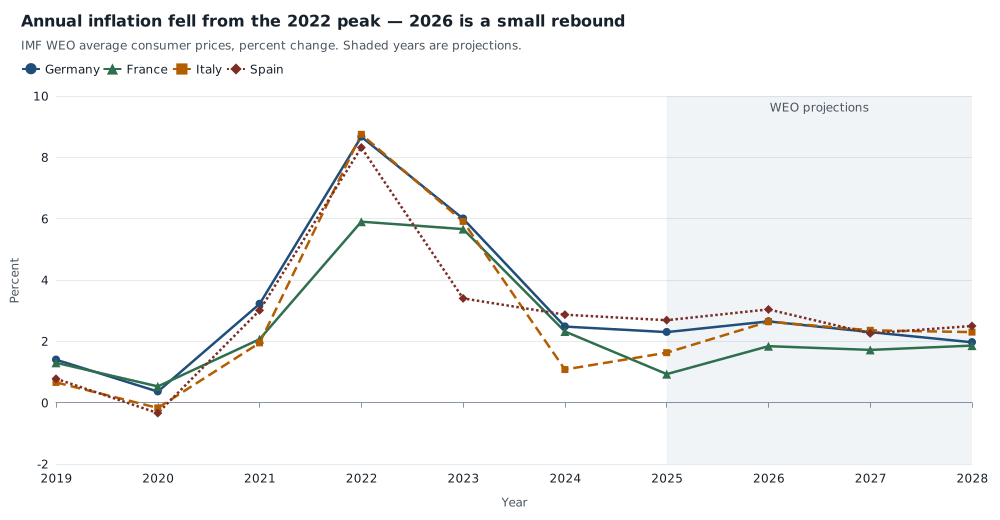
IMF WEO annual average consumer-price inflation (percent change), 2019–2028. Italy is dashed; Spain is dotted. The shaded window marks projection years in this snapshot. Source: IMF World Economic Outlook.
Energy prices are rising. They are not at 2022.
The inflation comparison only answers half of the fear. If oil and European gas were already back at 2022 levels in the Fund’s own prices, a 3 percent CPI print might just be the beginning.
They are not. IMF Brent averaged $99.00 a barrel in 2022 and $68.32 in 2025. The 2026 projection is $80.19 — almost $12 higher than 2025, and almost $19 below 2022. Average petroleum spot prices in the same database follow the same path: $96.36 in 2022, $67.74 in 2025, $82.22 in 2026.
European natural gas is the more distinctive 2022 story. The WEO’s European gas price averaged $37.52 per million British thermal units in 2022, after $4.45 in 2019. It then fell to $11.91 in 2025. The 2026 projection is $14.61 — 39 percent of the 2022 average. That 2026 figure is still above the 2000–2020 high of $13.14 in 2008. Gas has not gone back to the pre-crisis world. It has also not gone back to 2022.
The Fund’s broader energy price index (2016 = 100 in this series) rises 19 percent from 2025 to 2026, to 194.13, which is still only 65 percent of the 2022 reading of 299.51.
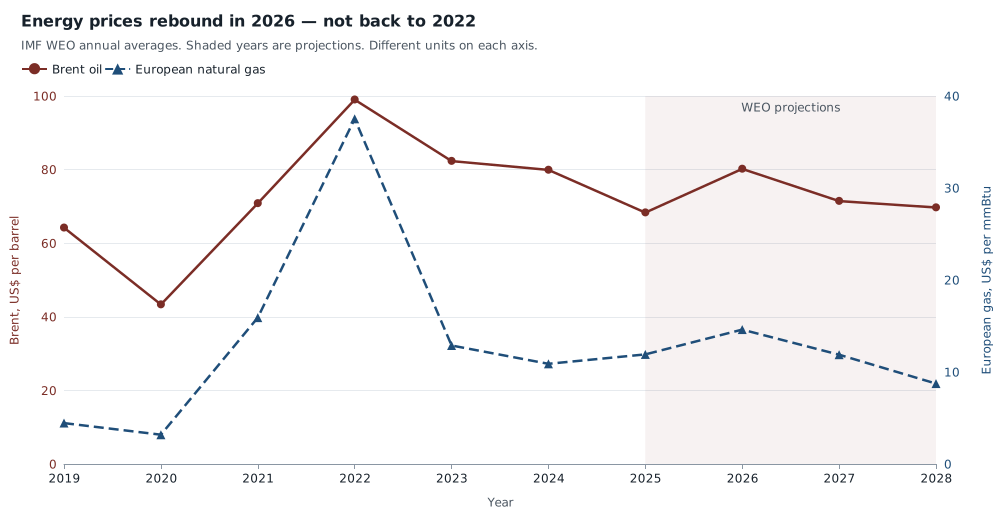
IMF WEO annual averages. Brent is in dollars per barrel (left axis); European gas is in dollars per mmBtu (right axis). The axes are not a common scale. 2026–2028 are projections. Source: IMF World Economic Outlook commodity prices (POILBRE, PNGASEU).
Those annual averages can coexist with a reported spot price above $106. A few weeks of $106 oil do not, by themselves, pull a yearly average to $106 — and the Fund’s 2026 oil assumption of about $80 looks too low if prices stay where late-April headlines put them. If Hormuz stays blocked, the 2026 inflation projections above would be too low as well. This dataset does not measure how much of a $106 barrel passes into German or Spanish CPI, and it does not include monthly oil prices.
What it does show is the scale of 2022. Even a serious 2026 energy rebound, in the Fund’s own numbers, is a rise from a disinflation that had already happened.
What a 3 percent print would actually mean
The policy argument hidden in the 2022 comparison is simple. An 8 percent annual rate forced the European Central Bank into a historic tightening. A 3 percent annual rate, after two years of 2-ish percent, is a reason to wait — which is what reporting said the ECB did — not a reason to treat the inflation target as lost.
It is also a reason not to flatten France into Spain. France’s 2025 annual rate of 0.93 percent and 2026 projection of 1.84 percent are a different household reality from Spain’s 2.69 percent then 3.04 percent. Germany and Italy sit in between, both projected near 2.6 percent. The United Kingdom, whose central bank was also reported as holding rates through an inflation “surge,” is projected at 3.2 percent for 2026 after 9.07 percent in 2022.
None of this says energy is cheap, or that a prolonged Hormuz closure would be harmless. European gas at $14.61 is more than three times 2019. Brent at $80 is well above the 2020 collapse. The point is narrower, and more useful: in the IMF’s annual inflation accounts, the large euro-area economies are not back in 2022. They are in a 2-to-3 percent band that used to look like a bad year in the 2000s — and that, after 8 percent, looks like the disinflation holding.
Methods and sources
This is retrospective research, written 10 September 2026 about events discussed on 3 August 2026. It uses the IMF WEO snapshot ingested 10 August 2026 and sealed 24 August 2026, which can include revisions that were not published on the digest date. Years through 2025 are treated as historical or estimated annual values; 2026–2028 are treated as WEO projections. The extract has no estimate/projection flag; that split follows usual April-vintage WEO practice for a snapshot taken between the April and October 2026 publications.
Inflation is PCPIPCH, annual average consumer prices, percent change, for Germany (DEU), France (FRA), Italy (ITA), Spain (ESP), the United Kingdom (GBR) and the United States (USA). The linked inflation chart is a multi-country page; pick those ISO3 geographies in the selector. The snapshot’s group geography G119 has a null name and is not used as a euro-area aggregate. Oil is POILBRE (Brent, dollars per barrel) and POILAPSP (average petroleum spot); European gas is PNGASEU (dollars per mmBtu); the energy index is PNRGW. Those commodity series are stored on geography G001. Official IMF pages: the World Economic Outlook and primary commodity prices.
Reported April 2026 claims of euro-area inflation at 3 percent and oil above $106 a barrel come from news feeds (Associated Press copy via PubEurope; Handelsblatt headlines; an Al Jazeera headline on oil). They are not observations in this dataset. Browser and mobile layout of the charts were not separately tested beyond SVG rendering.
Research Date
The displayed date matches the related news edition. Research was completed 2026-09-10.
Related news: Daily · 2026-08-03
More Research
The Danube Can Take Hungary’s Nuclear Plant Offline. It Cannot Replace It.
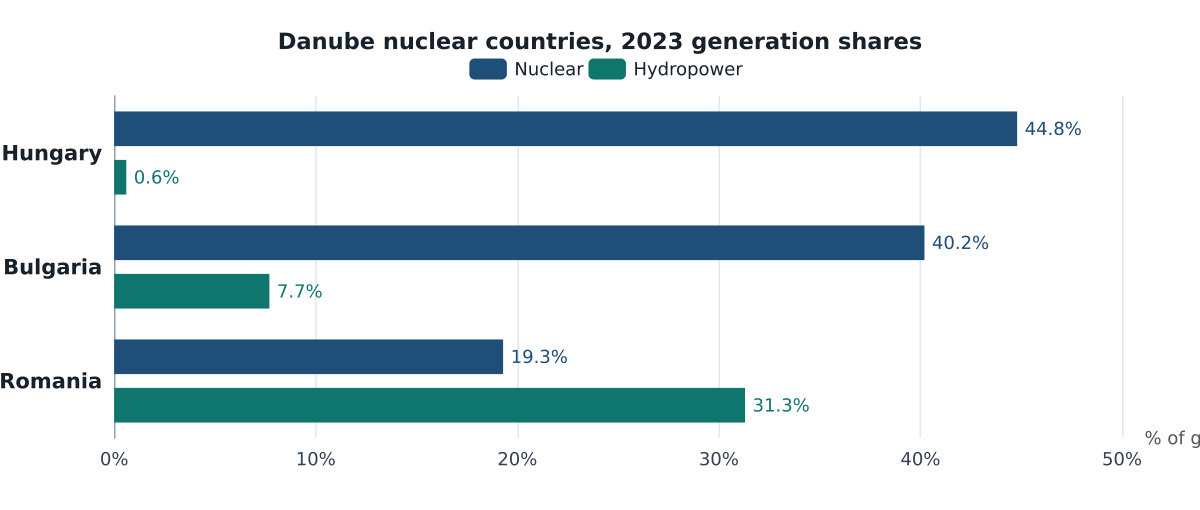
In 2023 Hungary generated 45 percent of its electricity from nuclear and 0.6 percent from hydro. A low Danube can take the plant offline; it cannot replace it.
Airline Jobs Have Not Collapsed. The Bill Is In The Wage.
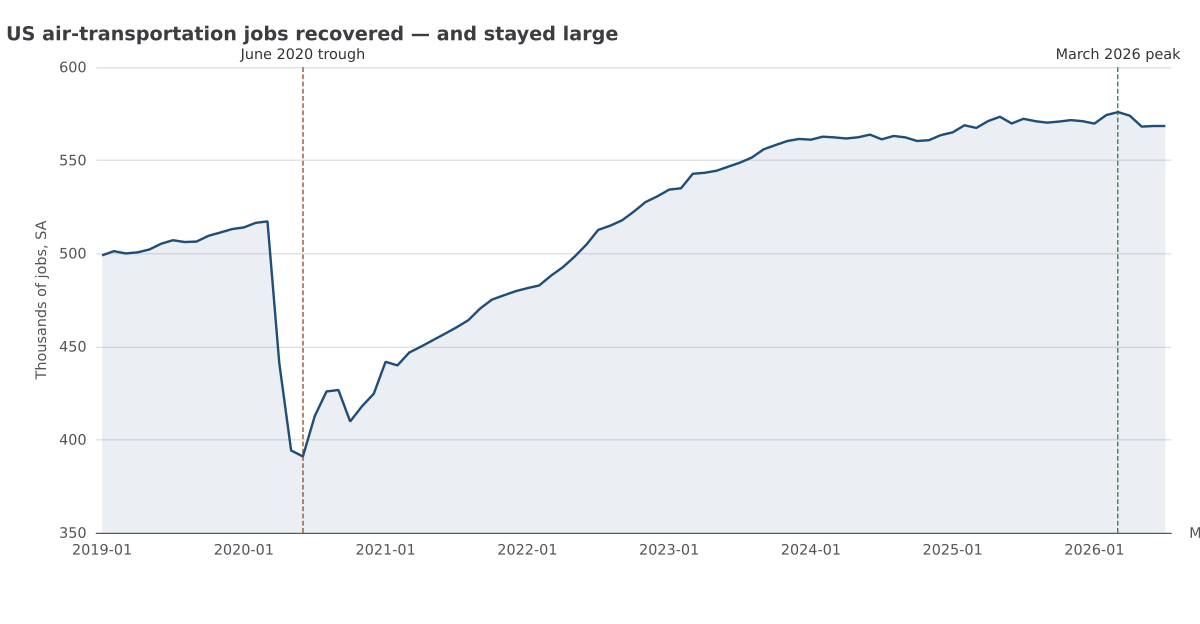
US air-transportation jobs in mid-2026 were still well above 2019. The cost pressure is in wages and hours, not a 2020-style payroll collapse.
Ghana Locked The Cocoa Trees After The Beans’ Price Tripled
Ghana criminalized converting cocoa farms after world cocoa prices tripled in the IMF series — a spike the Fund already assumes will halve.