LunarWeave
Half The World's Solar Capacity Now Sits In China
Beijing's draft export curbs on next-generation solar technology landed as a supply-chain story: who gets the next wave of cells, wafers and manufacturing know-how. The electricity accounts already on the books answer a prior question. The world's operating solar fleet is concentrating in China, not spreading out.
In 2024, plants in China generated 839.6 terawatt-hours of solar electricity, 39.9 percent of the International Renewable Energy Agency's world total of 2,105.8 TWh. That was more than IRENA's Europe region, the United States and India put together (743.8 TWh). By the end of 2025, China's photovoltaic capacity had reached 1,200.4 gigawatts — 50.1 percent of world solar capacity of 2,396.7 GW.
Those shares are not a snapshot of a country that got there first and then stood still. In 2015 China produced 15.8 percent of the world's solar electricity and held 19.2 percent of year-end capacity. Europe then generated 43.8 percent of the world's solar power. By 2024 Europe's generation share had fallen to 16.2 percent.
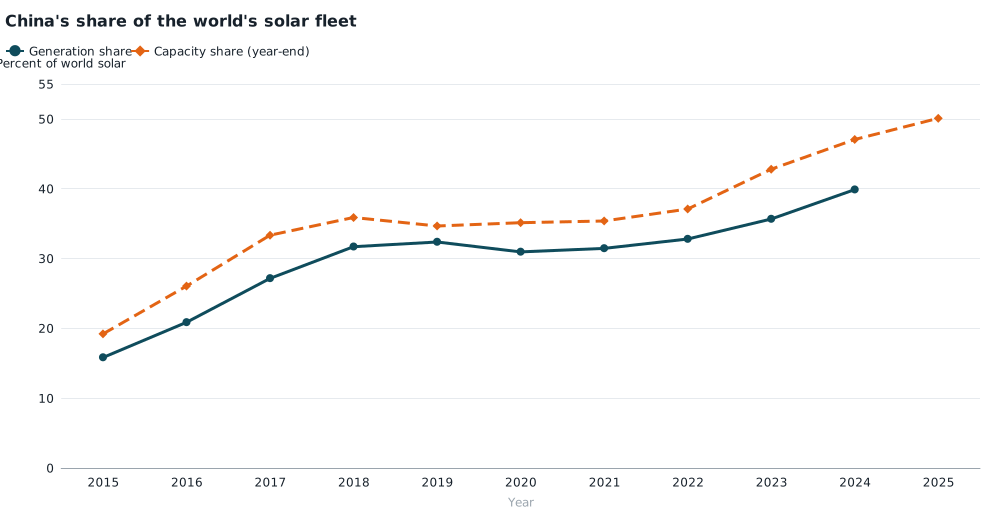
China's share of world solar electricity generation (2015–2024) and year-end solar capacity (2015–2025), percent. Generation is China photovoltaic plus solar thermal over IRENA world solar-energy generation; capacity is China photovoltaic over world solar-energy capacity. 2024 generation is preliminary at aggregate levels. These series locate electricity and plants, not manufacturing of panels. Source: IRENA IRENASTAT.
A one-year increment larger than India's entire output
The Hindu reported that a Chinese draft labelled Announcement No. 48 would ban 14 technologies outright and restrict 26 more, including next-generation solar technologies that could affect countries such as India that want to rely less on China. The counts and the legal text are the newspaper's reporting, not an independent reading of the draft. What IRENA can show is the scale of the electricity systems that reporting is talking about.
India is already the world's third-largest solar generator, at 127.9 TWh in 2024 — 6.1 percent of the world total, behind China and the United States (274.6 TWh). It is not a rounding error. It is also not closing the gap. China's solar output rose by 255.7 TWh from 2023 to 2024, twice India's entire 2024 generation. At the end of 2025, China's photovoltaic fleet was 8.9 times India's (135.2 GW) and 5.7 times the United States' (209.5 GW).
The latest capacity increment is more lopsided still. World solar capacity rose by 513.5 GW between end-2024 and end-2025. China accounted for 314.2 GW of that increase, 61.2 percent. The rest of the world added 199.3 GW.
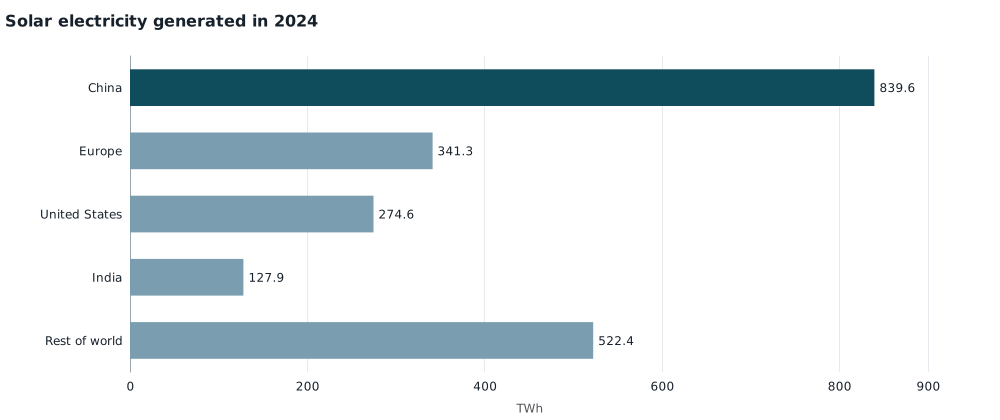
Solar electricity generation in 2024, terawatt-hours. China is photovoltaic plus solar thermal; the United States and India are photovoltaic; Europe is IRENA's Europe region for solar energy. Rest of world is the residual after those four groups, so the bars sum to world solar-energy generation (2,105.8 TWh). 2024 generation is preliminary at aggregate levels. Source: IRENA IRENASTAT.
| Measure | 2015 | Latest |
|---|---|---|
| China's share of world solar generation | 15.8% | 39.9% (2024) |
| China's share of world solar capacity | 19.2% | 50.1% (end-2025) |
| Europe's share of world solar generation | 43.8% | 16.2% (2024) |
| India's share of world solar generation | 2.2% | 6.1% (2024) |
India's generation share did rise from 2.2 percent in 2015 to 6.1 percent in 2024. That is real catch-up from a small base. It has not offset China's pull-away, and the 2024 figure (6.1 percent) is actually a touch below 2023 (6.6 percent) because world solar generation grew faster than India's that year.
Solar still does not run China's grid
None of this means China has swapped coal and gas for solar. Solar was 8.3 percent of China's electricity in 2024, against 6.8 percent of world electricity, 6.4 percent in India and 6.0 percent in the United States. The percentages sit in a narrow band. The difference is the size of the Chinese power system: 10,088 TWh of electricity in 2024, versus 4,581 TWh in the United States and 1,991 TWh in India.
China dominates world solar because it is an enormous grid that has added solar at a pace no other country has matched, not because solar has taken over Chinese electricity. Asia as a whole generated 56.2 percent of world solar electricity in 2024; China alone was 71.0 percent of that Asian total.
What export curbs would and would not change
IRENA's tables record electricity generated and capacity installed in a place. They do not record who manufactured the modules, inverters or production equipment, and they do not measure the next-generation processes a licensing regime would try to fence off. A solar farm in India or Texas can be assembled from Chinese parts; a factory in China can ship kits that never appear as Chinese generation. Manufacturing concentration, which other reporting has long described as higher than China's generation share, is a different fact.
What the electricity books do establish is the starting point for any curb on future technology. China's existing plants would keep generating. The pressure would fall on everyone else's ability to keep adding, from a position that has already lost share for a decade. Europe's fall from 43.8 percent of world solar generation to 16.2 percent is the clearest version of that story. India's growing fleet is the version that matters if the draft rules are aimed at countries trying to build their own solar industries.
A restriction that merely slowed the rest of the world's installations would lock in a split that is already half the world's capacity in one country. Whether Beijing actually imposes the draft, and how tightly "next-generation" is drawn, is a policy question these annual totals cannot answer.
Methods and sources. This is retrospective research (17 October 2026) using IRENASTAT electricity capacity and generation, including the country electricity table, from a snapshot compiled 8 October 2026, after the 16 October 2026 news. Country figures for China, India and the United States are solar photovoltaic from IRENA's country electricity table; China's solar-thermal generation (35.8 GWh in 2024, 0.004 percent of its solar output) is added so that China's generation can be compared with world "solar energy," which includes thermal. Europe and world totals use IRENA's solar-energy series. Capacity is year-end installed net generating capacity; generation is annual gross electricity, including on- and off-grid output and industrial self-consumption. IRENA's table footnote states that 2024 generation is preliminary and not accurate at aggregate levels. Electricity totals are IRENA renewable generation plus non-renewable generation. Empty is not treated as zero. Browser layout of the charts was not separately tested.
Research Date
The displayed date matches the related news edition. Research was completed 2026-10-17.
Related news: Daily · 2026-10-16
More Research
Cuba Still Has An Oil-Fired Grid. It Has Stopped Getting Electricity Out Of It.
Cuba's October blackout hit an oil-fired grid that had already lost nearly a third of its electricity since 2018 while keeping most plants on the books.
California Already Collects A Quarter Of America's State Income Taxes
California collected a quarter of U.S. state income taxes in 2025 with 11.5% of the population, then watched those receipts fall a fifth while personal income kept rising.
America’s Hosting-And-Search Industry Is Already 2 Percent Of GDP. That Is Not A Map Of Data Center Alley.
BEA accounts show data processing, hosting and internet search already at 1.9 percent of U.S. GDP and about a ninth of 2025 real growth, with value added concentrated in California and Washi