LunarWeave
Five Percent China Is The New Slope — And The IMF Does Not See A Rebound
When reports in mid-July described China's economy growing at its slowest pace in years despite a boom in artificial intelligence and electric vehicles, the implied question was whether something had broken. Sectoral booms are easy to see. National accounts are slower, and they answer a different question: has China merely stumbled, or has the growth machine that defined the 2000s and 2010s already been rewritten at a lower speed?
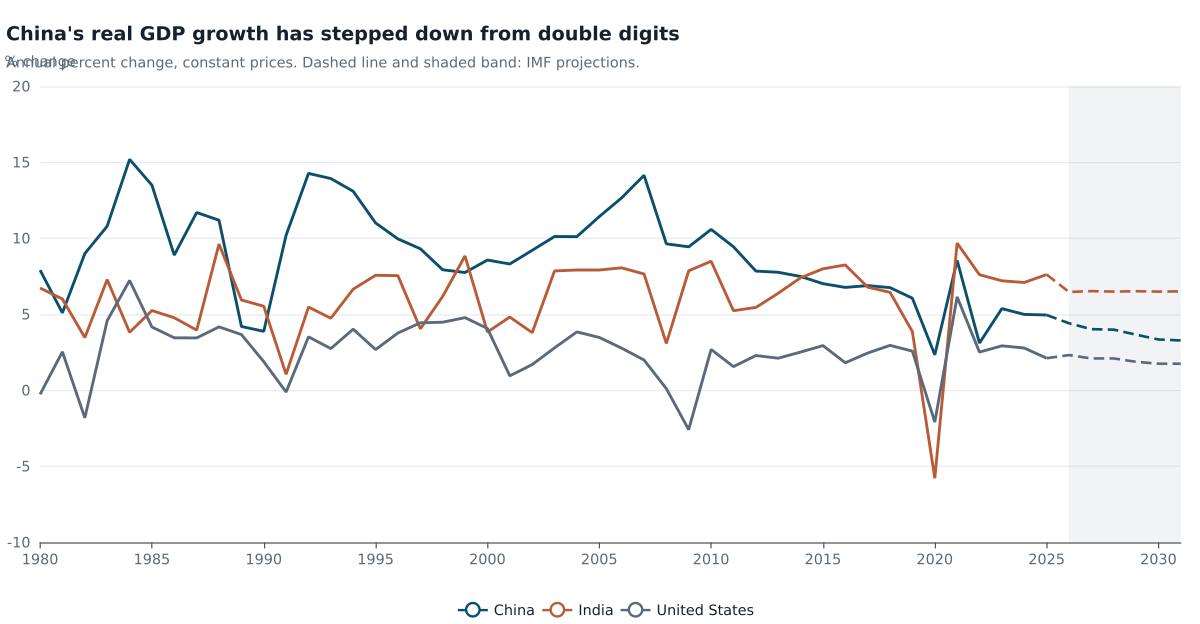
The International Monetary Fund's World Economic Outlook, in the vintage pinned for this research, already treats the slower speed as the baseline. Real GDP growth — the annual percent change in constant-price output — averaged 10.4 percent a year in the 2000s and 7.7 percent in 2010–19. It was 5.0 percent in 2024. The Fund's 2025 estimate is 4.96 percent. Its projections then keep sliding, to 4.4 percent in 2026 and 3.3 percent in 2031. That is not a forecast of collapse. It is a forecast that the old Chinese growth rate does not come back.
The Fund's figures are annual, not quarterly, and 2026 onward are projections rather than outturns. They cannot confirm or refute any single quarter's print. What they can show is that a "slowest in years" headline is arriving after the annual data have already stepped down, and after the IMF has stopped writing a rebound into the books.
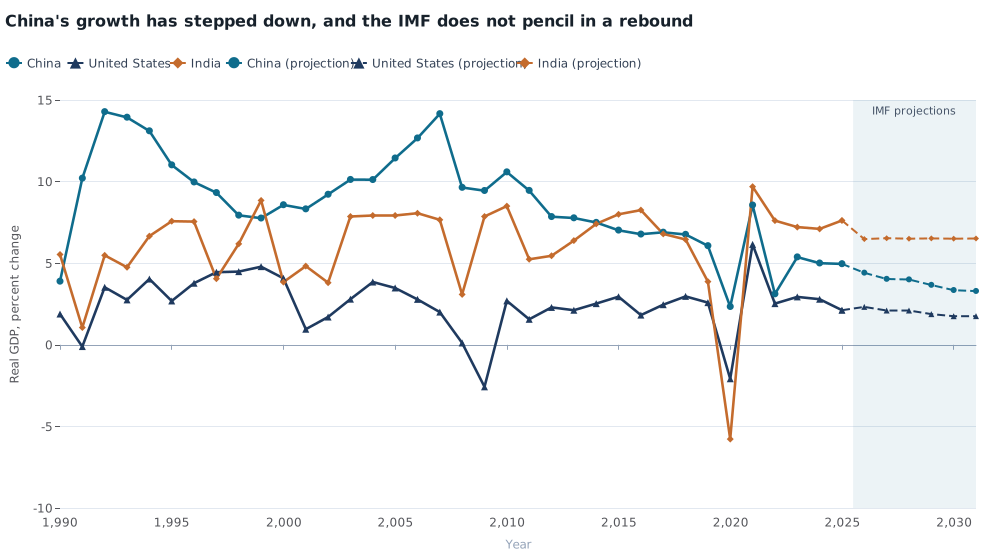
Annual real GDP growth, percent change in constant-price GDP. Solid lines run through the 2025 estimate in this IMF vintage; dashed lines from 2025 are projections through 2031. Source: IMF World Economic Outlook. Choose China, the United States or India on the same series page. Annual growth is not a quarterly print; projections are not realized outcomes.
The slowdown is already in the history, not only in the forecast
Inside 1990–2024, China's weakest years were 2020 (2.3 percent) and 2022 (3.1 percent) — the pandemic year and the later zero-Covid slump. Set those two years aside and 1990, at 3.9 percent, is the slowest remaining year. 2024, at 5.0 percent, is next. In other words, last year's outturn was already the slowest non-crisis year of the past three decades except 1990.
That matters because 5 percent China still sounds fast next to rich countries. The same vintage puts the United States at 2.1 percent in 2025 and India at 7.6 percent. India has been the faster large economy for several years. China remains much larger. Speed and weight are not the same fact.
| Period | Kind | China | United States | India |
|---|---|---|---|---|
| 1990–1999 | Historical average | 10.1 | 3.2 | 5.8 |
| 2000–2009 | Historical average | 10.4 | 1.9 | 6.3 |
| 2010–2019 | Historical average | 7.7 | 2.4 | 6.6 |
| 2020–2024 | Historical average | 4.9 | 2.5 | 5.2 |
| 2025 | IMF estimate | 5.0 | 2.1 | 7.6 |
| 2026–2031 | IMF projection, average | 3.8 | 2.0 | 6.5 |
Averages of annual real GDP growth (percent). 2025 is an estimate in this vintage; 2026–31 are projections. Source: IMF World Economic Outlook, NGDP_RPCH.
A slower China is still a heavy China
Measured at purchasing-power parity, China was 12.7 percent of world GDP in 2010 and 19.6 percent in the 2025 estimate — larger than the United States at 14.6 percent and more than twice India at 8.2 percent. PPP shares are not the same as dollar GDP; they ask how much output each economy produces when prices are equalized, not how much it invoices in greenbacks. On that measure, China is still gaining, slowly, even as its growth rate falls.
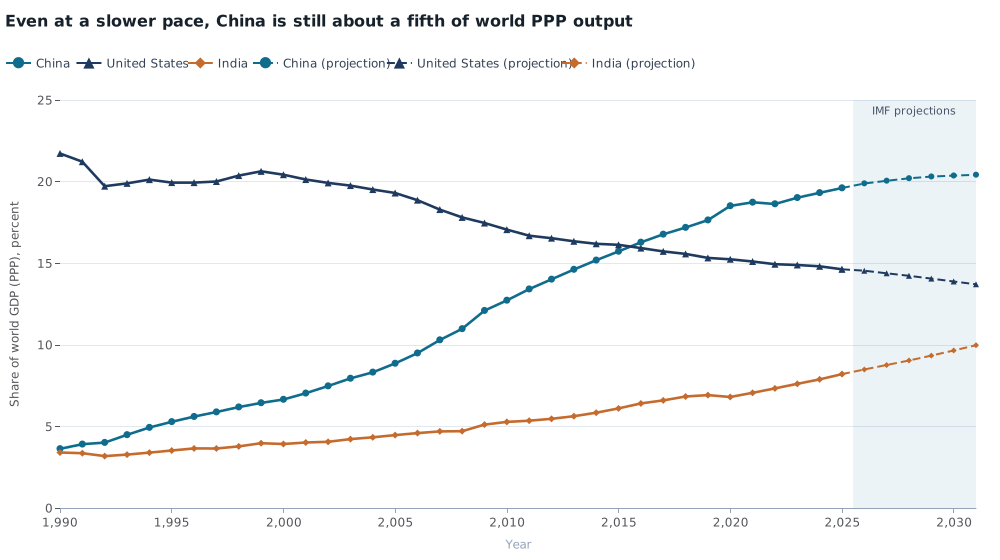
Share of world GDP at purchasing-power parity, percent. Solid lines through 2025; dashed lines are IMF projections. Source: IMF World Economic Outlook series PPPSH. Readers need to select China, the United States or India in the chart. PPP shares differ from current-dollar GDP shares.
Weight still converts a middling growth rate into a large addition to world output. A simple accounting check — last year's PPP share times this year's growth — says China added about 0.96 percentage points to world PPP growth in 2025, against 0.60 from India and 0.31 from the United States. In 2010 the same arithmetic gave China 1.28 points. The engine is quieter than it was. It has not stalled, and it is still the largest of the three.
The same accounts leave China far from rich-country living standards. PPP GDP per person in 2025 is about $29,400 in China, $90,000 in the United States and $11,800 in India. A 5 percent expansion from one-third of US income per person is a different event from a 10 percent expansion when China was 13 percent of the world economy.
The boom is not showing up as prices — or as a new growth model
If AI and electric vehicles were overheating the whole economy, consumer prices would be an obvious place to look. They are not. Average consumer-price inflation in China was 0.23 percent in 2023, 0.21 percent in 2024 and 0.05 percent in 2025. The United States, in the same vintage, is at 2.7 percent in 2025. Near-zero inflation is not proof that factories are idle, and it is not a GDP figure. It is evidence that the demand side of the household basket has been weak enough to keep prices flat while official output still grows.
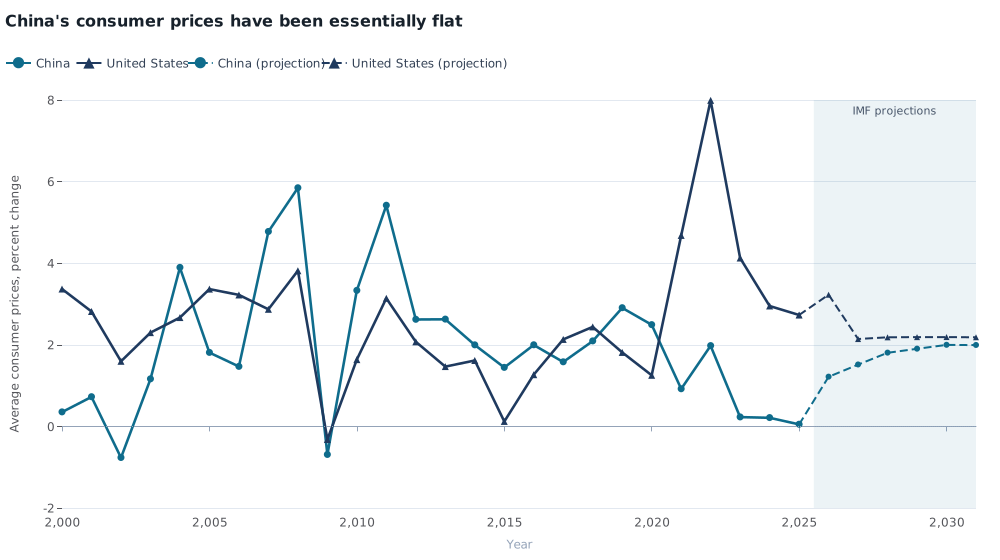
Annual average consumer-price inflation, percent. Solid lines through 2025; dashed lines are IMF projections. Source: IMF World Economic Outlook, PCPIPCH. This is a consumer-price index, not a GDP deflator.
Nor has China quietly become a consumption-led economy in these accounts. Total investment was 46.6 percent of GDP at its 2011 peak and 38.8 percent in 2025 — lower, but still about double the US 21.4 percent. A country can have world-class EV plants and still be investing, in the aggregate, like an industrializer rather than like a rich consumer society. The IMF's investment ratio cannot say whether those plants are profitable. It can say the old capital-heavy shape of the economy has only partly unwound.
What the slower slope means
The useful reading of a "slowest in years" China is not that the world's second-largest dollar economy, and largest PPP economy, has suddenly lost its ability to add output. It is that 5 percent is no longer a disappointing year on the way back to 8. In this vintage it is the middle of a downward path, with consumer prices already at a standstill and with India now the faster large grower.
That combination is awkward for anyone who treats Chinese growth as a binary: either a miracle or a crisis. The accounts describe a third state. China remains heavy enough that even a 4–5 percent expansion still does more for world PPP output than the United States or India. It is no longer fast enough, or inflationary enough, to look like the boom that those EV and AI headlines describe. The risk in the Fund's numbers is not a 2022-style collapse. It is a long slide toward 3 percent from a country that is still only about one-third as rich as America per person.
Sources and methods
This is retrospective research completed on 10 September 2026, using a pinned IMF World Economic Outlook snapshot ingested in August 2026. It is not an as-of reconstruction of what was knowable on 16 July 2026. Observation years are not release dates.
Figures are annual IMF WEO series: NGDP_RPCH (real GDP, percent change), PPPSH (PPP share of world GDP), PCPIPCH (average consumer-price inflation), NID_NGDP (total investment as a percent of GDP) and PPPPC (PPP GDP per capita). 1990–2024 are treated as historical, 2025 as the latest-year estimate in this vintage, and 2026–31 as projections. Approximate contributions to world PPP growth multiply the previous year's PPP share by the current year's growth; that is an accounting identity under those weights, not a causal attribution. G001, used only in the calculation file as a world growth comparator, is the snapshot's world aggregate (IMF code 001); the geography dictionary stores a null name, so world growth is not cited in the body.
Official source: IMF World Economic Outlook. MacroVedia pages linked above are the same measures; readers must choose the country in the chart, and a live portal vintage can differ from the pinned snapshot even when the cited years currently match. SVG charts were rendered from ECharts; this session did not include separate browser or mobile layout checks.
Research Date
The displayed date matches the related news edition. Research was completed 2026-09-10.
Related news: Daily · 2026-07-16
More Research
Britain’s Economy Grew. Britons Are Barely Richer.
IMF figures show the UK economy is larger than in 2019, but real GDP per person has barely risen — the constraint Andy Burnham inherits.
China Is Still Built For 10% Growth. It Is No Longer Delivering It.
IMF annual accounts show China’s 4.3% quarter arriving after a decade-long growth downshift, with investment still near 39% of GDP and a widening current-account surplus.
Pakistan Is Resetting Fuel Prices After Already Closing Its Current-Account Gap
IMF current-account figures show Pakistan had already closed its 2022 external gap when it moved to daily fuel-price resets; Egypt had not.