LunarWeave
China Is Still Built For 10% Growth. It Is No Longer Delivering It.
China’s statistics bureau put second-quarter growth at 4.3% from a year earlier — the weakest official quarter since late 2022, and below the government’s already-lowered 4.5–5% annual target, according to reporting on 15 July 2026 from NPR, France 24 and The Hindu. The same accounts described lagging household spending and business investment, with exports — helped, they said, by artificial intelligence — doing more of the work.
That mix is easy to misread as a one-quarter stall. The IMF World Economic Outlook annual series, retrieved in August 2026, shows something more stubborn: China has been stepping down from double-digit growth for a decade, while still saving and investing as if the old miracle were intact. The surplus that gap creates is the external engine the headlines noticed.
The 4.3% quarter is official Chinese data, not an IMF figure, and a quarterly year-on-year print is not an annual average. What the Fund’s accounts can answer is whether that print arrived against a long downshift, and whether “weak domestic demand, strong exports” is visible in saving, investment, the current account and trade volumes.
A decade of slower growth, not a sudden stall
In the IMF series for real GDP growth (constant prices, annual percent change), China averaged 10.6% a year from 2000 through 2007 and 7.7% from 2010 through 2019. By 2019 the rate was already 6.1%. After the pandemic collapse to 2.3% in 2020 and the 3.1% zero-COVID year of 2022, growth recovered only to 5.4% in 2023, 5.00% in 2024 and 4.96% in 2025.
The Fund’s 2026 projection is 4.41% — already below the 4.5–5% target reported with the July print — then 4.0% in 2027 and 3.3% in 2030. Readers should choose China in the chart selector on that series page; the values cited here are from the pinned August 2026 WEO snapshot, which matches the live points checked for 2024–2026.
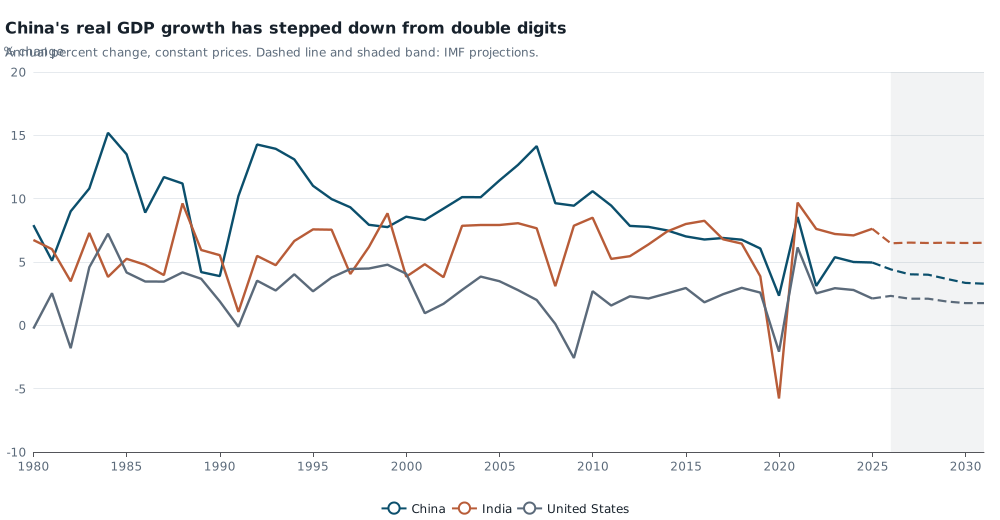
Annual percent change in real GDP (constant prices). Solid lines run through 2025; dashed lines and the shaded band are IMF projections for 2026–2031. The 4.3% official quarter is not plotted. Source: IMF World Economic Outlook, NGDP_RPCH.
Through 2025, annual growth below 5% had occurred only in 1989 (4.2%), 1990 (3.9%), 2020, 2022 and 2025. The 2026 projection would join that short list. India, on the same measure, grew 7.62% in 2025 and is projected at 6.5% in 2026. China is still expanding faster than the United States (2.12% in 2025), but it is no longer the large-economy growth champion of the 2000s.
The investment ratio fell. It did not become normal.
News of “lagging business investment” is easy to overhear as an investment collapse. The IMF’s total investment share of GDP says otherwise. China’s investment ratio peaked at 46.5% of GDP in 2010, was 42.6% in 2019, and 38.8% in 2025. That is a drop of 7.7 percentage points from the 2010 peak and 3.8 points from 2019 — investment growing more slowly than GDP, not a vanishing capital stock.
It is still an outlier. In 2025 the same series put India at 33.9% of GDP, Japan at 27.7%, Germany at 21.9% and the United States at 21.4%. China remains an economy that puts close to two-fifths of output into investment after the slowdown has already arrived.
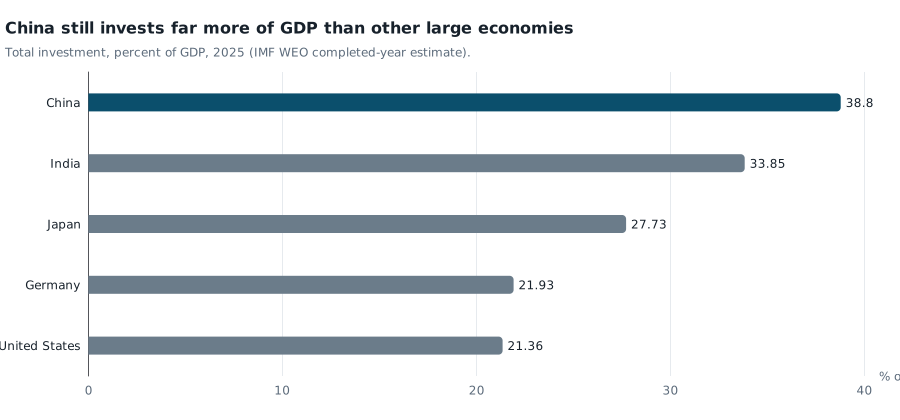
Total investment, percent of GDP, 2025. These are expenditure shares, not growth rates of investment. Source: IMF World Economic Outlook, NID_NGDP.
Gross national saving stayed higher still: 42.5% of GDP in 2025, against 16.8% in the United States and 32.9% in India. High saving is income not consumed. The IMF file has no private-consumption series, so this is not a household spending measure. It is the national-accounts counterpart of the “sluggish consumption” in the July coverage.
The surplus is doing more of the work
When a country saves more than it invests, the difference shows up as a current-account surplus. In these extracts that identity holds to published precision. China’s current-account balance was 0.7% of GDP in 2019 and 3.7% in 2025. The surplus widened as the investment ratio slipped and saving stayed above 42% of GDP.
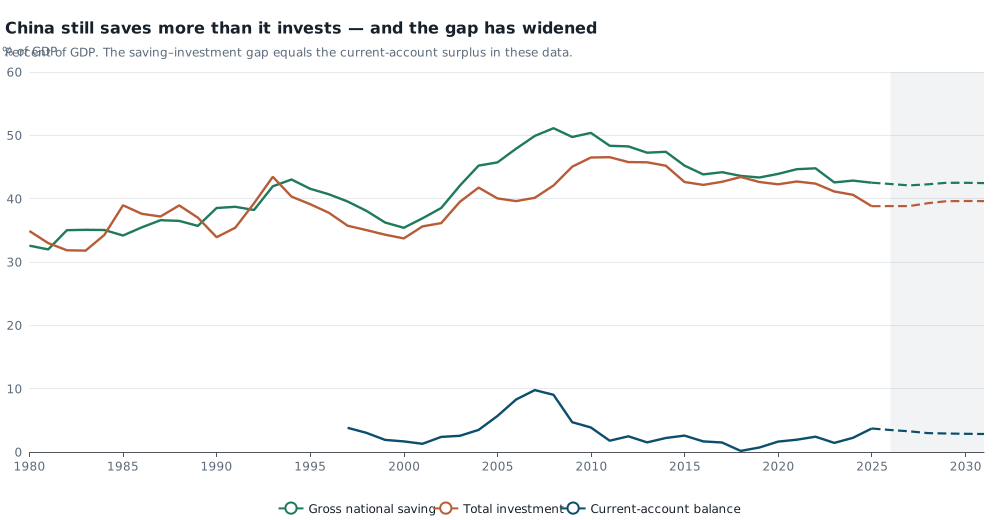
Percent of GDP. The saving–investment gap matches the current-account surplus in these series. Dashed lines from 2026 are IMF projections. Source: IMF World Economic Outlook, NGSD_NGDP, NID_NGDP, BCA_NGDPD.
Trade volumes tell the same story from the border. Export volumes rose 12.6% in 2024 and 9.7% in 2025; import volumes rose 6.0% and 2.6%. The Fund projects the gap to persist in 2026 (7.5% versus 2.3%). Volume is not the value of AI goods, and it cannot confirm the industry mix in the news. It can show external shipments running ahead of domestic absorption.
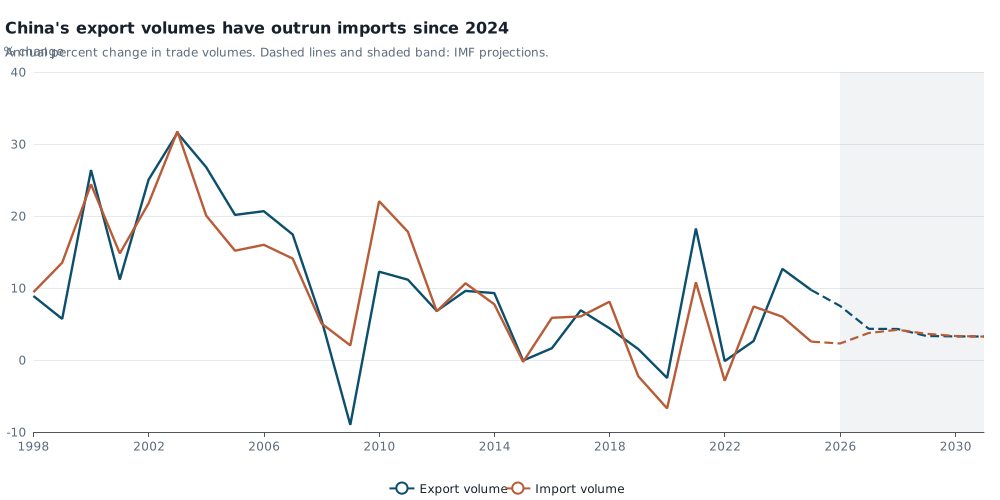
Annual percent change in trade volumes. Dashed lines from 2026 are IMF projections. Source: IMF World Economic Outlook, TX_RPCH and TM_RPCH.
| Economy | Real GDP growth, 2025 (%) | Investment (% of GDP) | Saving (% of GDP) | Current account (% of GDP) |
|---|---|---|---|---|
| China | 4.96 | 38.8 | 42.5 | 3.7 |
| India | 7.62 | 33.9 | 32.9 | −0.9 |
| Japan | 1.19 | 27.7 | 32.6 | — |
| Germany | 0.24 | 21.9 | 26.3 | 4.4 |
| United States | 2.12 | 21.4 | 16.8 | −3.6 |
IMF World Economic Outlook completed-year estimates for 2025. Japan’s current-account series was not pulled for this table. Growth is annual percent change in real GDP; other columns are percent of GDP.
Not an overheating story, and not a surplus of fiscal restraint
Average consumer-price inflation in China was 0.23% in 2023, 0.21% in 2024 and 0.05% in 2025 on the WEO measure, with 1.2% projected for 2026. The slowdown is arriving with near-zero inflation, which is consistent with weak domestic demand and inconsistent with an overheating boom.
The official unemployment rate in the same database has hovered near 5% since the series begins in 2017 (5.1% in 2025). That series cannot speak to youth unemployment or informal urban joblessness, and it should not be used to dismiss labour-market strain reported elsewhere.
Nor is the downshift a story of a government surplus. IMF general-government net lending was −6.0% of GDP in 2019 and −7.9% in 2025 (−8.2% projected in 2026). A wide deficit can coexist with slowing growth; these figures do not identify whether the composition of spending is reaching households or the property sector.
What the 4.3% quarter changes — and what it does not
The July print matters because it is below the target Beijing had already cut, and because it is a quarterly reading the annual WEO cannot replace. It does not, by itself, mark a break with the 2023–2025 step-down already in the Fund’s file. The more consequential pattern is compositional: China still allocates almost 39% of GDP to investment and more than 42% to saving, while the current-account surplus has widened and export volumes have outrun imports.
That is not a consumer-led rebalancing. It is a slower-growing investment economy whose unused saving is spilling abroad. The IMF path then drifts toward 3% growth by the end of the decade. If that projection is even roughly right, the political problem is not how to recover 10% growth. It is how to live with 4% while the domestic engine still looks like the old one.
Property distress, the AI content of exports, and any 2026 oil-shock effect from the war around the Strait of Hormuz are not in these series. They may be part of the quarterly story. They are not required to see that the slowdown is older than one summer.
Sources and methods
This is retrospective research written on 10 September 2026 about reporting from 15 July 2026. It uses the IMF World Economic Outlook SDMX dataset (dataflow IMF.RES/WEO/9.0.0), retrieved 10 August 2026 and pinned in the normalised snapshot of 24 August 2026 — later than the digest date. Figures for 2026–2031 are treated as projections because 2026 was incomplete on retrieval; 2025 is a completed year still subject to WEO revision. Observation dates are 1 January of each year, not release dates. The extracts do not carry IMF estimate flags.
Official source: IMF World Economic Outlook. Direct series pages for real GDP growth, investment and the current account are multi-country charts; select China. Those live pages matched the pinned 2024–2026 (growth), 2010/2019/2025 (investment) and 2019/2025 (current account) values when checked. MacroVedia is not the statistical producer.
SVG rendering is not a substitute for browser or mobile layout checks.
Research Date
The displayed date matches the related news edition. Research was completed 2026-09-10.
Related news: Daily · 2026-07-15
More Research
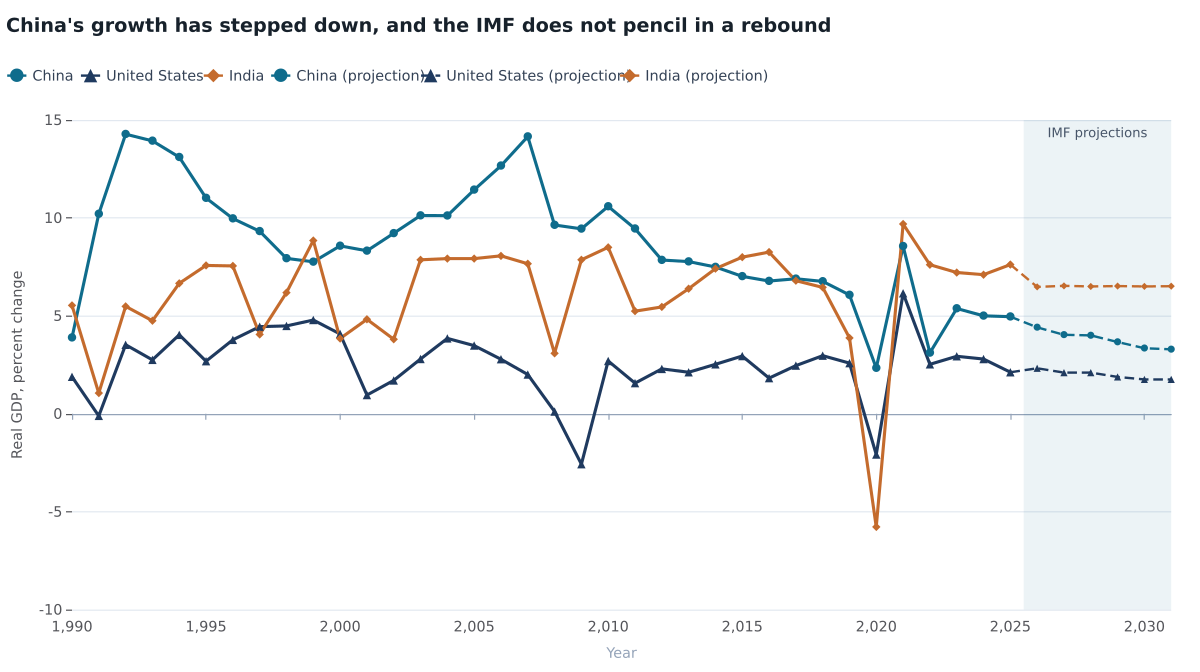
Five Percent China Is The New Slope — And The IMF Does Not See A Rebound
IMF annual accounts already treat China’s 5 percent growth as the baseline, with no rebound through 2031, even though China remains about a fifth of world PPP output.
The Data-Center Boom Is Not A Jobs Boom
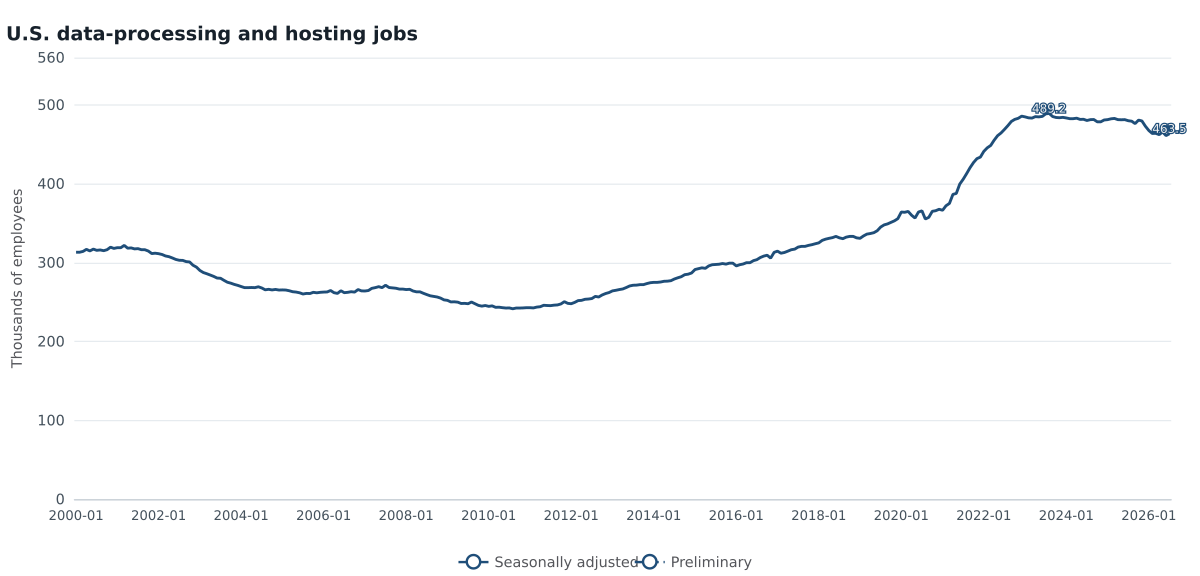
New York paused large data centers over power and community strain. National hosting still employs about 464,000 people, below its 2023 peak.
Britain’s Economy Grew. Britons Are Barely Richer.
IMF figures show the UK economy is larger than in 2019, but real GDP per person has barely risen — the constraint Andy Burnham inherits.