LunarWeave
The Data-Center Boom Is Not A Jobs Boom
New York became the first U.S. state to freeze large new data centers, pausing permits for facilities that would draw 50 megawatts or more. Governor Kathy Hochul said the pause was about utility bills, water and community strain, not about turning away an employment engine. The official jobs and payroll numbers say she was describing the right problem.
The industry that actually hosts and processes data still employs fewer than half a million people nationwide. Its headcount has been drifting down for three years. What has grown is the pay attached to those jobs — and, in New York, a neighboring internet-publishing industry that is easy to confuse with warehouses full of servers.
A small workforce, already past its peak
The Bureau of Labor Statistics counts payroll jobs in “computing infrastructure providers, data processing, web hosting, and related services” — the closest national industry to the buildings New York just paused. In July 2026 that industry employed 463,500 people, a seasonally adjusted figure that is still preliminary. That was 0.29 percent of U.S. nonfarm employment.
The jobs burst, such as it was, already happened. Employment jumped during 2021–23, peaked at 489,200 in August 2023, and has since fallen by 25,700, or 5.3 percent. July 2026 was still 107,700 jobs above December 2019. It was not a hiring wave by the standards of a 159 million-person payroll economy.
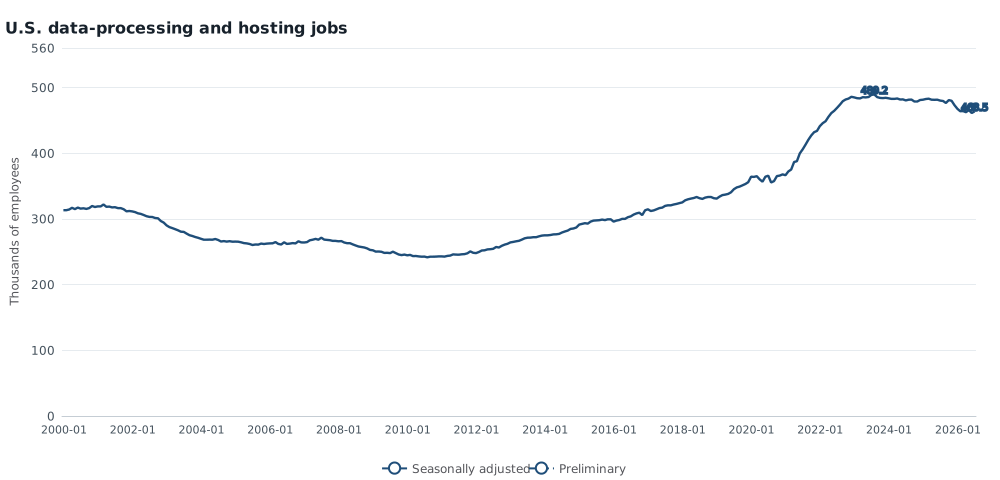
Seasonally adjusted payroll employment in computing infrastructure, data processing, web hosting and related services, United States, January 2000–July 2026, thousands of employees. June and July 2026 are preliminary. This is a jobs count, not megawatts or hyperscale capacity. Source: U.S. Bureau of Labor Statistics, Current Employment Statistics series CES5051800001.
From January 2000 to July 2026 the industry added 48 percent more jobs. That is modest over a quarter-century, and it includes a long slump after the dot-com bust. The recent AI build-out shows up as a two-year spike, then a plateau and a decline — not as a new mass employer.
Payrolls doubled. Headcount did not.
Pay is a different story. The Bureau of Economic Analysis tracks compensation of employees — wages, salaries and supplements — in data processing, hosting, and related services (NAICS 518). That is the subsector BEA defines as establishments that “provide the infrastructure for hosting and/or data processing services.”
In 2024 those payrolls totaled $109.7 billion in the United States, up 102 percent from $54.3 billion in 2019. The comparison is in current dollars, so part of the rise is inflation. Even so, compensation doubled while national headcount in the same industry rose much less and then slipped. That is what a capital- and power-intensive boom looks like in labor data: fewer people, more expensive people, and a footprint that shows up on the grid rather than in the jobs report.
The same table shows where the payrolls sit. California accounted for $29.0 billion in 2024 — 26 percent of the U.S. total, more than the next three states combined. Texas was second at $10.1 billion. New York was third, at $6.56 billion, or 6.0 percent of the national hosting payroll.
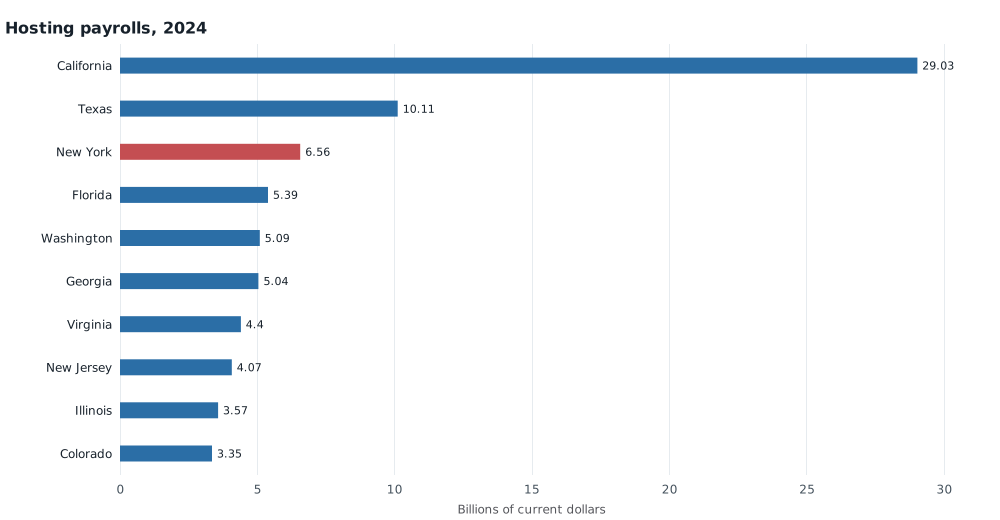
Compensation of employees in data processing, hosting, and related services (NAICS 518), 2024, billions of current dollars, top 10 states. New York is highlighted. Compensation is not electricity use; a warehouse of servers can be large in megawatts and modest in payroll. Source: U.S. Bureau of Economic Analysis, table SAINC6N, 9 April 2026 release.
Virginia, the usual shorthand for “Data Center Alley,” ranked seventh, at $4.40 billion. That does not mean Virginia hosts fewer servers. It means hosting does not hire many people. In a state whose private economy is much smaller than New York’s, those payrolls still punch above their weight: 1.36 percent of Virginia private nonfarm compensation in 2024, against 0.70 percent in New York and 0.88 percent in the United States as a whole.
New York’s hosting payrolls grew 80 percent from 2019 to 2024, slower than the national doubling. Georgia’s grew 139 percent; California’s, 130 percent. The geography of the boom, on this measure, is not a New York story.
| State | 2024 hosting compensation | Share of U.S. | Change since 2019 |
|---|---|---|---|
| California | $29.0 billion | 26.5% | +130% |
| Texas | $10.1 billion | 9.2% | +107% |
| New York | $6.56 billion | 6.0% | +80% |
| Florida | $5.39 billion | 4.9% | +90% |
| Washington | $5.09 billion | 4.6% | +79% |
| Georgia | $5.04 billion | 4.6% | +139% |
| Virginia | $4.40 billion | 4.0% | +101% |
Compensation of employees, NAICS 518, current dollars. Rank includes the 50 states and the District of Columbia. Source: BEA SAINC6N.
New York’s information economy is not mostly warehouses
A reader looking only at state GDP could get the wrong impression. BEA’s GDP tables do not publish hosting on its own. They combine NAICS 518 with “other information services” (NAICS 519) — web search portals, exclusive internet publishing, news syndicates, libraries and archives. On that combined line, New York produced $66.6 billion of output in 2024, or 2.9 percent of the state’s $2.32 trillion economy. Real output in the combined grouping more than doubled from 2019 to 2024. That is a large, fast-growing slice. It is not a data-center census.
Payrolls that BEA does split tell the difference. In 2024 New York paid $20.0 billion to workers in other information services and $6.56 billion in hosting. Search and internet publishing were three times the hosting payroll, and they have been larger for the entire 2010–24 window. Virginia is the reverse: hosting payrolls there were 3.6 times other-information-services pay.
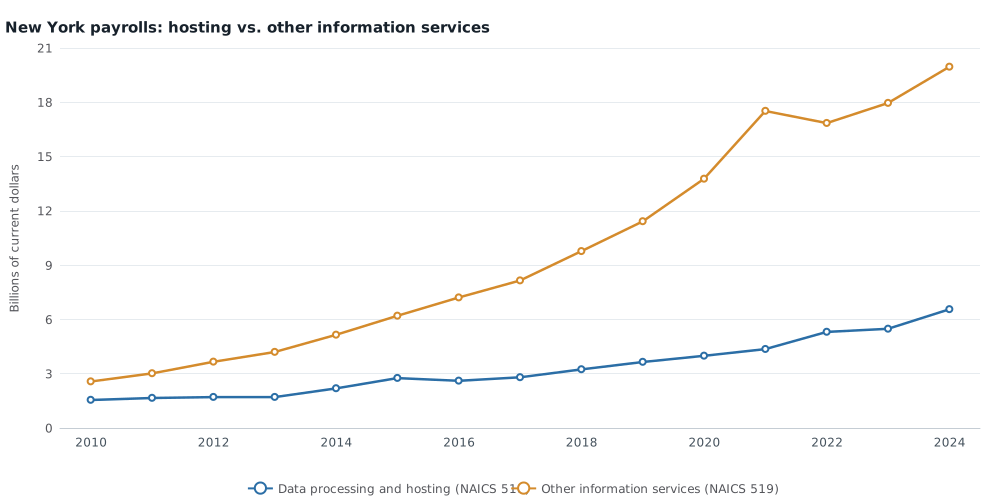
New York compensation of employees, 2010–2024, billions of current dollars. NAICS 518 is hosting and data-processing infrastructure; NAICS 519 includes web search and exclusive internet publishing. Current dollars are not inflation-adjusted. Source: BEA table SAINC6N.
So New York is a real hosting-payroll state — third in the country — and a much larger internet-publishing state. A moratorium on 50-megawatt facilities is aimed at the first of those, and at projects that have not yet received permits. It does not measure, and these figures cannot measure, how many megawatts already sit in the state or how much a new campus would add to a household electric bill.
What the numbers cannot settle
None of this says the pause is wise or unwise. Electricity prices, water use and land-use conflict are the issues Hochul named, and they are not in these tables. Compensation also understates a data center’s physical presence: servers, buildings and power connections can loom large while the on-site workforce stays small. National employment and state payrolls are the wrong tools for counting warehouses. They are the right tools for asking whether the country is living through a jobs boom in this industry.
It is not. The United States still employs about 464,000 people hosting and processing data. New York already has a sizable share of those payrolls and a much larger internet-information sector beside them. The strain that produced a first-in-the-nation freeze is the kind of strain a capital-intensive industry creates — on the grid and on neighbors — not the strain of a new mass employer arriving in town.
Sources and methods. Figures are retrospective: they use statistical releases available at research time (10 September 2026), not the information a reader would have had on 14 July 2026. Employment is from the BLS Current Employment Statistics survey, seasonally adjusted, national industry CES5051800001 and total nonfarm CES0000000001, in a snapshot dated 24 August 2026; June and July 2026 observations are preliminary. Compensation and GDP are from BEA’s 9 April 2026 annual state release (tables SAINC6N, SAGDP2 and SAGDP9). Industry GDP for 2025 had not been published in that snapshot; 2024 is the latest year used for industry payrolls and GDP. NAICS 518 is broader than hyperscale data centers. Combined 518–519 GDP is broader still. Compensation is in current dollars. State ranks include the District of Columbia. SVG charts were rendered from the saved extracts; they have not been separately checked in a browser.
Research Date
The displayed date matches the related news edition. Research was completed 2026-09-10.
Related news: Daily · 2026-07-14
More Research
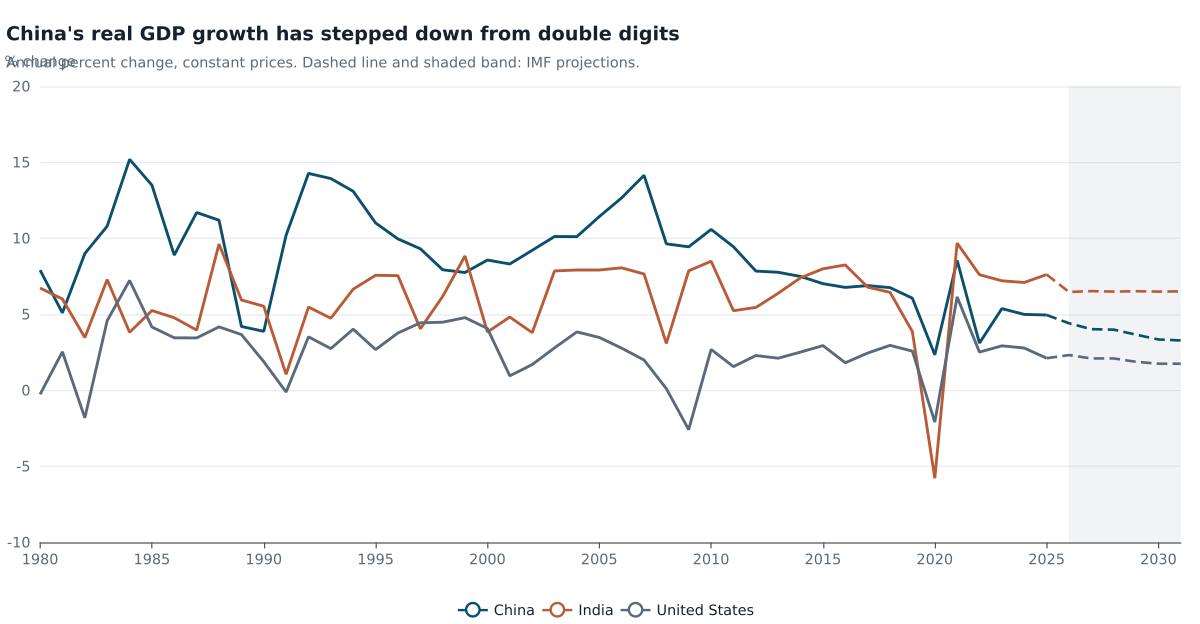
China Is Still Built For 10% Growth. It Is No Longer Delivering It.
IMF annual accounts show China’s 4.3% quarter arriving after a decade-long growth downshift, with investment still near 39% of GDP and a widening current-account surplus.
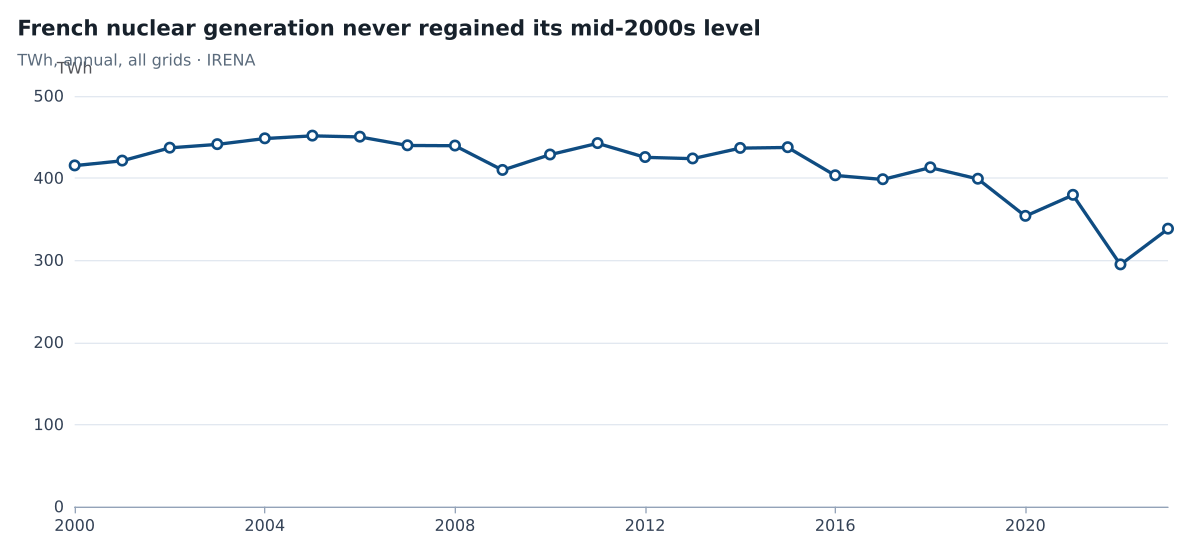
France Still Gets Most Of Its Electricity From Nuclear. The Plants Are Producing Less Of It.
France still generated 64 percent of its electricity from nuclear in 2023, a quarter below the 2005 peak, so river-temperature limits are a first-order grid risk.
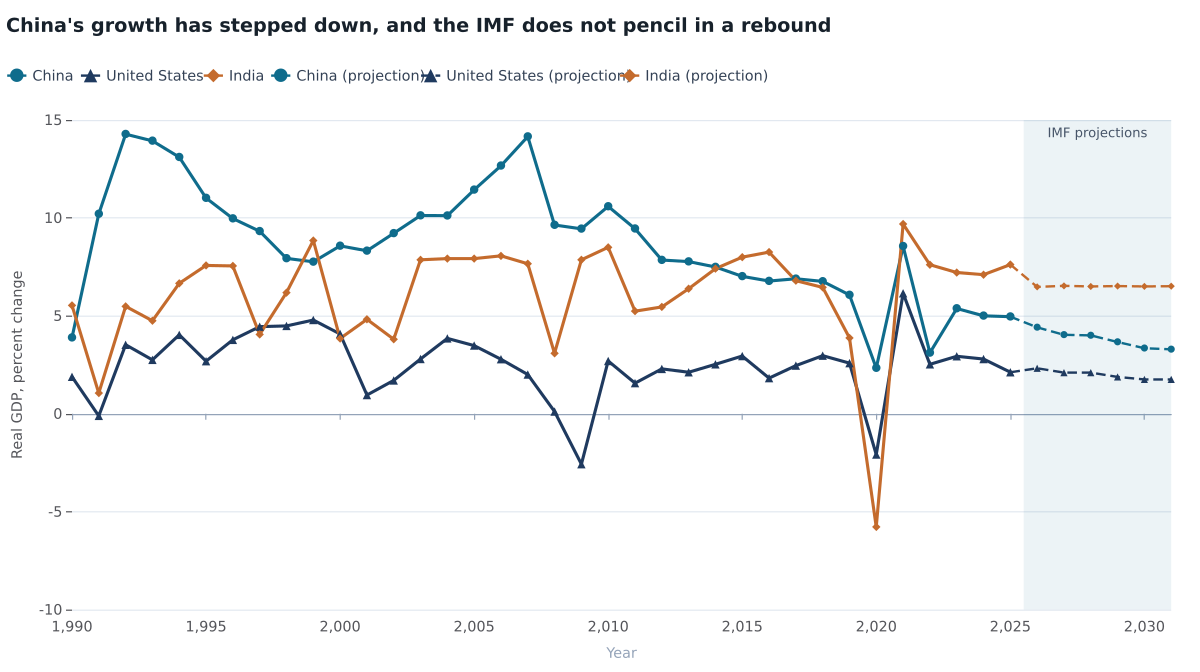
Five Percent China Is The New Slope — And The IMF Does Not See A Rebound
IMF annual accounts already treat China’s 5 percent growth as the baseline, with no rebound through 2031, even though China remains about a fifth of world PPP output.