LunarWeave
U.S. Hiring Stalled In 2025. Real Pay Has Now Flattened Too.
A monthly jobs report of 29,000 can sound like the labor market hit a wall. By the time that September 2026 figure circulated, the government’s payroll survey had already been running near that pace — and sometimes shrinking — for more than a year. Inflation-adjusted hourly pay, which had still been edging higher, stopped rising in the first half of 2026.
That distinction matters. Weak hiring that arrives as a surprise is a shock. Weak hiring that has already been the regime is a different economy: one in which job growth no longer absorbs new workers at the old clip, and in which a fresh burst of consumer-price pressure lands on paychecks that are no longer pulling ahead.
News reports of the September employment report put payroll gains at 29,000 and the unemployment rate at 4.2 percent (UPI). Those numbers are not in the Current Employment Statistics snapshot used here, which ends in July 2026. What the snapshot can answer is whether a print that small would be a break with the establishment survey, or a continuation of it.
The slowdown was already in the books
The Bureau of Labor Statistics’ Current Employment Statistics program counts jobs on employer payrolls. Its three-month average change in total nonfarm employment — a series BLS publishes so that one noisy month is not mistaken for a turning point — averaged 414,000 jobs a month in 2022 and 212,000 in 2023. In 2024 the average was 117,000. In 2025 it was 26,000.
By July 2026 the three-month average was 20,000. July itself was a 23,000-job decline. May and June had added 63,000 and 20,000. The 20,000 July average is simply those three months combined.
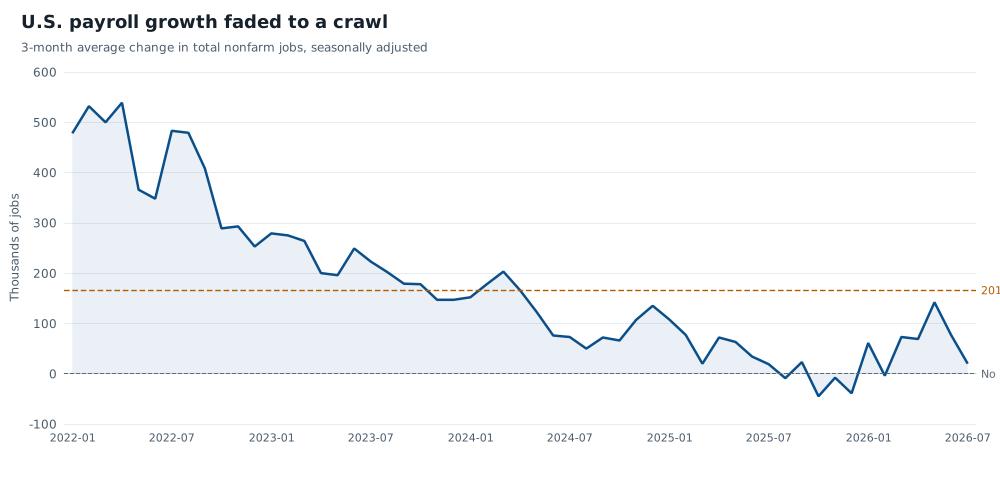
Three-month average change in U.S. total nonfarm employment, thousands of jobs, seasonally adjusted, January 2022–July 2026. The dashed line is the 2019 average of the same series (166,000). Source: U.S. Bureau of Labor Statistics, CES0000000026. The snapshot ends in July 2026.
A year-to-July comparison of payroll levels tells the same story in fewer steps. From July 2023 to July 2024, total nonfarm employment rose by 1.705 million. The next twelve months added 794,000. The twelve months to July 2026 added 316,000.
| Period | Net change in total nonfarm jobs |
|---|---|
| July 2023 – July 2024 | +1,705,000 |
| July 2024 – July 2025 | +794,000 |
| July 2025 – July 2026 | +316,000 |
From December 2024 through July 2026 the United States added 542,000 payroll jobs in total — about 29,000 a month. A reported September gain of 29,000 would sit on that 19-month average, not below it.
The stall is not only a government-payroll story, but government did pull the headline down. Private employment rose by 801,000 over those 19 months; government employment fell by 259,000. Even the private gain is a crawl beside 2019, when the three-month average for the whole economy was running at 166,000 jobs a month.
This is an idle engine, not a crash
Employment has not collapsed. In July 2026 there were 158.858 million nonfarm jobs, still 6.565 million above February 2020. The 2025–26 pattern is a loss of forward speed, not a 2008-style wipeout. In 2009 the same three-month-average series spent the year around minus 465,000 jobs a month.
The monthly path is choppy. February 2026 dropped 156,000 jobs; March added 214,000. Five months since the start of 2025 show a negative three-month average (August, October, November and December 2025, and February 2026). Outside the 2020 pandemic collapse, the series had not printed a three-month average of 20,000 or less at any point from 2011 through 2024. The weak prints are new for this expansion. They are also not a single-month accident.
That is why a 29,000 September figure, if it survives revisions, would not by itself prove that hiring “broke” in the autumn. It would show that the survey was still where it had been in midsummer.
Real hourly pay has stopped compounding
Nominal wages have not frozen. Average hourly earnings of all private employees were $37.62 in July 2026, 3.2 percent above a year earlier. After BLS deflates that series into 1982–84 dollars, the picture changes.
Real average hourly earnings reached $11.38 in February 2026 (and had already touched that level in November 2025). They fell to $11.23 in May and stood at $11.30 in July. Compared with a year earlier, real hourly pay was down 0.8 percent in May and 0.18 percent in July.
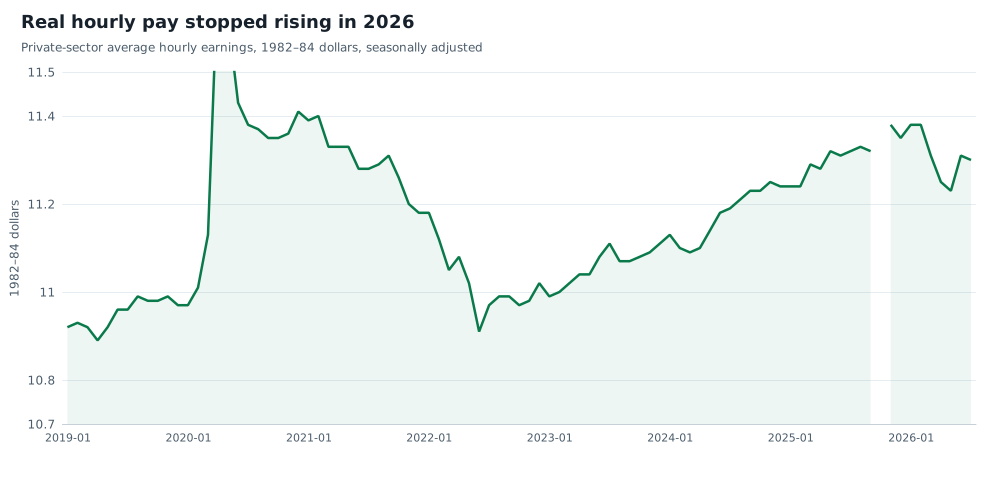
Seasonally adjusted average hourly earnings of all private employees, 1982–84 dollars, January 2019–July 2026. October 2025 is missing in the snapshot. The vertical axis starts at $10.70, not zero. Source: U.S. Bureau of Labor Statistics, CES0500000013. Average hourly earnings can move with the mix of jobs as well as with pay rates.
Two caveats belong next to that dip. First, average hourly earnings are not a wage index for the same people. When the mix of jobs shifts toward higher- or lower-paid work, the average moves even if nobody’s rate of pay changes — the April 2020 spike in this series is the classic example. Second, a few tenths of a 1982–84 dollar is a small move. What it is not is continued real-wage gains. After a grind higher through 2024 and 2025, the deflated series stopped making new ground just as energy costs were again dominating inflation headlines.
This article cannot pin the 2026 real-pay dip on oil or diesel. The CES earnings series does not identify the prices that eroded it. It can say only that private hourly pay, once inflation is stripped out, was no longer rising through July.
What the stall changes
A labor market that adds a few tens of thousands of jobs a month can still set a record level of employment. It cannot absorb a surge of new entrants, a layoff wave, or a jump in the cost of living the way a 200,000-a-month market can. That is the practical meaning of the 2025–26 payroll fade. The September report’s headline, as reported, would not open that chapter. The chapter was already being written in the monthly survey — and, by spring 2026, in the inflation-adjusted paycheck as well.
Sources and methods. Figures are from the U.S. Bureau of Labor Statistics Current Employment Statistics, seasonally adjusted, in a snapshot whose latest month is July 2026 (CES documentation). Job counts are thousands of payroll positions, not people; multiple jobholders can be counted more than once. The three-month average change is BLS series CES0000000026, not a separately smoothed model. Real average hourly earnings are BLS series CES0500000013. This is retrospective research completed on 3 October 2026 about events in a 2 October 2026 news cycle; later CES revisions, and the September 2026 report itself, are outside the pinned snapshot. No browser layout check was run on the charts beyond SVG rendering.
Research Date
The displayed date matches the related news edition. Research was completed 2026-10-03.
Related news: Daily · 2026-10-02
More Research
Ukraine Is Heading Into Winter With A Third Less Electricity Than Before The Invasion
Ukraine generated 36 percent less electricity in 2023 than in 2021. Real GDP began to recover that year; the grid did not.
France Still Owes Less Than Italy. Its Budget Has Not Closed.
IMF figures show France’s public debt still below Italy’s and Greece’s. The open 5% of GDP deficit is why the ratio is still rising.
Americans Are Filing More Businesses. They Are Not Planning To Hire.
Census weekly EIN filings ran 78 percent above 2019 in early 2026, but applications that indicated planned wages were 11 percent lower.