LunarWeave
France Still Owes Less Than Italy. Its Budget Has Not Closed.
When a large euro-area government is called the currency union’s weak link, the comparison is almost always Italy or Greece. That is the frame now being applied to France, the bloc’s second-largest economy: public debt past 119% of GDP, growth near zero, and — in the reporting — worse borrowing terms than Rome or Athens. The debt-stock half of that story does not survive contact with the IMF’s books. The budget-hole half does.
In the Fund’s World Economic Outlook figures used here, France’s general government gross debt is 116.0% of GDP in 2025, with a 2026 projection of 118.4%. That is a heavy load, and it is still rising. It is not, in this vintage, past 119%, and it is not higher than Italy’s 137.1% or Greece’s 145.7% in 2025. What has changed is the direction. France’s ratio is climbing again. Several of the countries that used to define euro-area fiscal crisis have been bringing theirs down.
A high ratio, not the highest
France remains far smaller than Germany in current dollars — about $3.37 trillion of GDP in 2025 against Germany’s $5.05 trillion — but larger than Italy ($2.55 trillion). Size is why a French fiscal problem is a euro-area problem. It is not evidence that Paris already carries Rome’s or Athens’s debt load.
General government gross debt as a share of GDP, on the IMF’s definition, puts France third among eight large or formerly high-debt euro-area economies in 2025: behind Greece and Italy, ahead of Belgium (106.3%), Spain (100.4%), Portugal (89.9%), Germany (62.9%) and the Netherlands (43.3%). Readers need to choose the country in that chart; the page does not pre-select France. The official IMF series is GGXWDG_NGDP.
The more important picture is the path, not the 2025 snapshot. France entered the pandemic at 98.2% of GDP. The ratio jumped to 114.9% in 2020, eased to 109.6% by 2023, then turned up again — 113.2% in 2024 and 116.0% in 2025. From 2019 to 2025 that is a rise of 17.8 percentage points, the largest increase in this eight-country group.
Greece and Italy went the other way after their 2020 peaks. Greece’s ratio fell from 209.9% of GDP in 2020 to 145.7% in 2025. Italy’s fell from 154.4% to 137.1%. Spain, which had almost the same 2019 starting point as France (97.6%), was back to 100.4% by 2025. Portugal cut 26.2 percentage points over 2019–25. France did not retrace the COVID spike. It added to it.
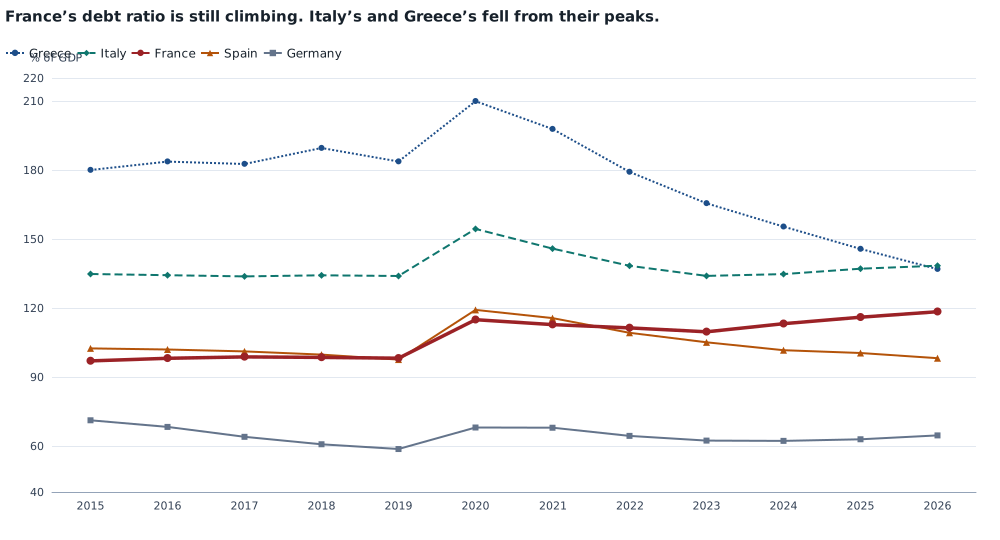
General government gross debt, percent of GDP, 2015–2026. 2026 is an IMF projection in this snapshot; 2025 is an IMF estimate. France’s line stays below Italy’s and Greece’s but is the one still rising after 2023. Source: IMF World Economic Outlook, series GGXWDG_NGDP.
A later national outturn can print a number this August 2026 WEO snapshot does not yet have. Reporting on 30 September 2026, citing Le Figaro and Le Monde, said French public debt had already exceeded 119% of GDP. That claim is not confirmed in this IMF snapshot, which still projects 118.4% for 2026. The qualitative point does not depend on winning an argument about 118 versus 119. On the Fund’s figures, France is approaching a round number that Italy and Greece passed years ago — while those two ratios, unlike France’s, have been falling.
The hole that keeps the ratio rising
Debt ratios fall when the budget tightens, growth outruns the interest bill, or inflation inflates the denominator. France is not getting much help from any of those.
General government net lending/borrowing — the IMF’s headline budget balance, official series GGXCNL_NGDP — shows a French deficit of 5.79% of GDP in 2024 and 5.11% in 2025. Among the same eight economies, only Belgium is in a similar hole (5.26% of GDP in 2025). Italy’s deficit is 3.11%. Germany’s is 2.67%, Spain’s 2.50%. Portugal is slightly in surplus. Greece is in surplus by 1.26% of GDP.
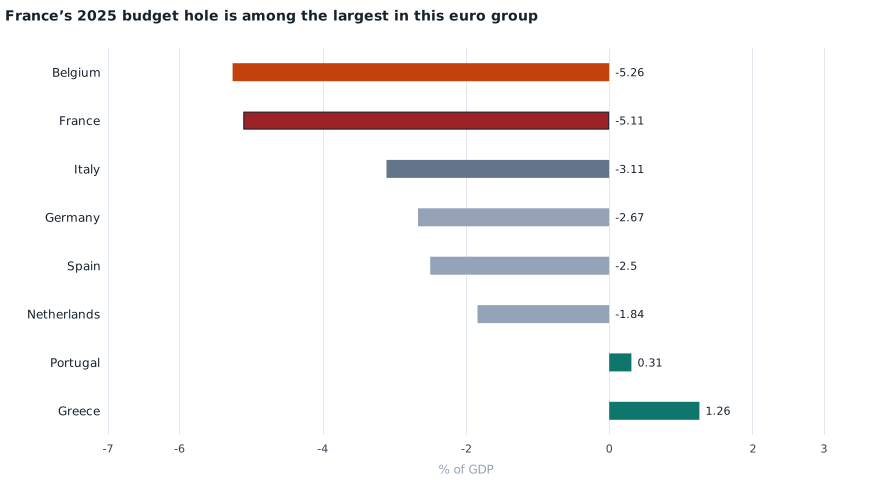
General government net lending/borrowing, 2025, percent of GDP. Negative values are deficits. 2025 figures are IMF estimates in the pinned August 2026 WEO snapshot. Source: IMF WEO, GGXCNL_NGDP.
Strip out interest and the gap is starker. On the IMF primary-balance series (GGXONLB_NGDP), France is still running a primary deficit of 3.13% of GDP in 2025. Italy has a primary surplus of 0.50%. Greece’s primary surplus is 4.44%. A country that borrows to cover day-to-day spending, not just the interest on old debt, will keep adding to the stock even if market yields are well behaved.
Growth is not riding to the rescue, but it is also not uniquely French. Real GDP, on the IMF’s annual constant-price growth series, rose 0.93% in France in 2025. That is sluggish. It is not the slowest print in this group: Germany grew 0.24% and Italy 0.54%. Spain grew 2.77% and Greece 2.07% — the same two economies that have been cutting their debt ratios. The 2026 projections in this vintage keep France at 0.86%, still below 1%, with Italy even slower. “Near zero” overstates 2025. A stalled recovery in the euro area’s two largest economies, with France a step behind Germany rather than uniquely frozen, is the better reading.
Unemployment does not make France the outlier either. The IMF’s 2025 jobless rate is 7.6% in France, against 10.5% in Spain, 8.9% in Greece, 6.1% in Italy and 3.8% in Germany.
| Country | Debt 2019 | Debt 2025 | Change, pp | 2025 growth | 2025 budget balance |
|---|---|---|---|---|---|
| Greece | 183.7 | 145.7 | −38.0 | 2.07 | +1.26 |
| Italy | 133.9 | 137.1 | +3.2 | 0.54 | −3.11 |
| France | 98.2 | 116.0 | +17.8 | 0.93 | −5.11 |
| Belgium | 97.6 | 106.3 | +8.8 | 0.97 | −5.26 |
| Spain | 97.6 | 100.4 | +2.9 | 2.77 | −2.5 |
| Portugal | 116.1 | 89.9 | −26.2 | 1.86 | +0.31 |
| Germany | 58.7 | 62.9 | +4.2 | 0.24 | −2.67 |
| Netherlands | 47.7 | 43.3 | −4.3 | 1.86 | −1.84 |
Debt and budget balance are percent of GDP. Growth is annual real GDP, percent. 2025 values are IMF estimates in this snapshot. Debt change is 2025 minus 2019, percentage points. Source: IMF WEO (GGXWDG_NGDP, NGDP_RPCH, GGXCNL_NGDP).
What this does not show
None of these series is a bond yield. Reporting that France now borrows on worse terms than Italy or Greece is a market-price claim. The IMF fiscal accounts cannot confirm or refute it. A higher deficit and a rising debt ratio are reasons investors might demand a larger spread. They are not the spread.
The comparison is also not the entire euro area. Ireland, Austria, Finland and the smaller members are outside this eight-country set. Adding them would not reverse the Italy/Greece debt-stock comparison; it would only underline that “weak link” is doing too much work if it means “highest debt.”
Belgium’s deficit is a reminder of the same point. France is not uniquely incontinent among euro members. It is uniquely large among the countries that still have a 5% of GDP hole. A Belgian deficit of that size is a Belgian problem. A French one is a problem for the currency union’s second-largest tax base, at a moment when public-sector strikes over pay and austerity are already in the streets.
The practical conclusion is narrower than the “weak link” headline and more awkward for Paris. France does not have Italy’s or Greece’s debt stock. It has not, on the IMF’s figures, copied their post-2020 fiscal correction. Until the primary deficit closes or growth returns, the ratio will keep grinding toward the round numbers that used to belong to someone else.
Sources and methods. Retrospective research (1 October 2026) on reporting from 30 September 2026. Figures are from a pinned IMF World Economic Outlook snapshot (normalized run dated 24 August 2026, raw extract 10 August 2026), not a reconstruction of what was public on 30 September 2026. Treat 2025 as IMF estimates, which can still be revised, and 2026 as projections. General government gross debt (GGXWDG_NGDP) and net lending/borrowing (GGXCNL_NGDP) are percent of GDP. Real growth is NGDP_RPCH. The primary-balance series is used by IMF code GGXONLB_NGDP; the local catalogue label for that series is swapped with the structural-balance code and is not used as a name. GDP in dollars is NGDPD, current US dollars, so the size ranking mixes volumes and exchange rates. Unemployment is LUR. Missing values are not treated as zero. Bond yields, credit ratings and intra-year national accounts outturns are outside this dataset.
Research Date
The displayed date matches the related news edition. Research was completed 2026-10-01.
Related news: Daily · 2026-09-30
More Research
Americans Are Filing More Businesses. They Are Not Planning To Hire.
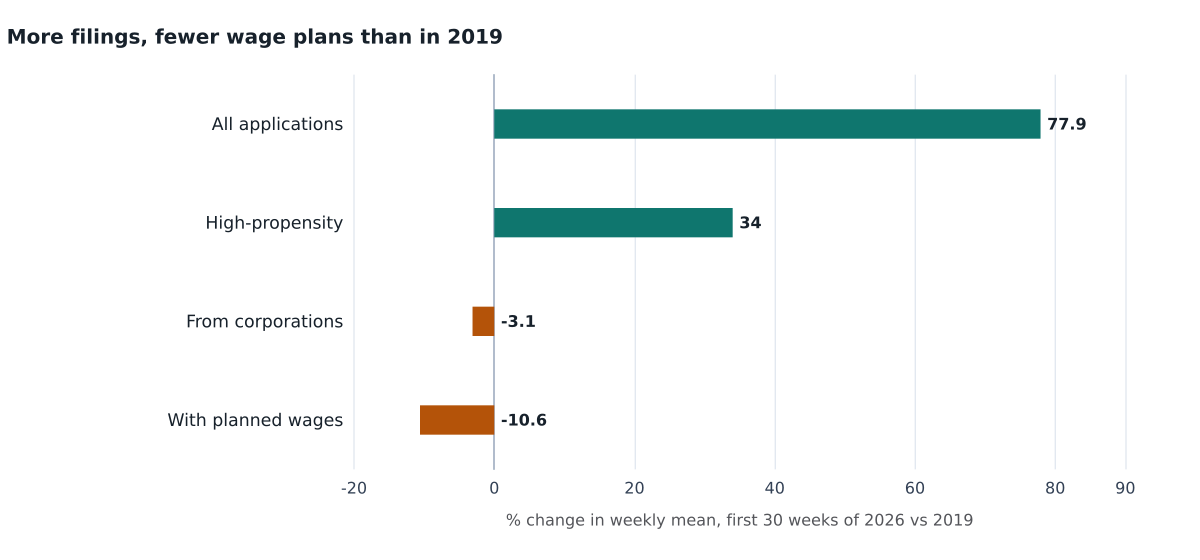
Census weekly EIN filings ran 78 percent above 2019 in early 2026, but applications that indicated planned wages were 11 percent lower.
America’s Grid Grew. The Plants That Run At Night Did Not.
U.S. on-grid capacity rose 23 percent from 2015 to 2025, almost all solar and wind, while fossil-plus-nuclear plants shrank.
Australia’s Inflation Average Hid The Turn
IMF accounts show Australia’s inflation boom had already cooled, then end-2025 prices turned back up — the highest among large rich peers — as the cash rate was reported heading to a 15-year