LunarWeave
Americans Are Filing More Businesses. They Are Not Planning To Hire.
Household surveys say U.S. consumers are miserable. The paperwork says they are still starting companies — just not the kind that intend to put anyone on a payroll.
On 29 September 2026, the Conference Board reported that its consumer confidence index had fallen 6.7 points to 81.9, the lowest reading since April 2014 and below the pandemic trough. Coverage of the release, including by the South China Morning Post, tied the drop to elevated prices and stagnant wages. That is a survey of how households feel. A different official series, the Census Bureau’s Business Formation Statistics, records how many people are applying for an employer identification number each week. Through the week ending 1 August 2026, those applications were running far above any pre-pandemic year in the weekly file — even while the mix of filings looked less and less like new employers.
The tension is not that households and entrepreneurs disagree. It is that the “startup boom” visible in EIN applications has been hollowed out. Americans are filing more businesses on paper. A shrinking share of those filings say they plan to pay wages.
A record pace of applications
Census weekly business applications are not seasonally adjusted, so a fair comparison is the same slice of the calendar, not a partial 2026 year against a full 2019 year. In the first 30 weeks of 2026 — weeks starting 4 January through 26 July — the United States averaged 129,129 applications a week. In the first 30 weeks of 2019 the weekly mean was 72,603. That is a 78 percent increase.
The 2026 pace is not just a rebound from lockdowns. It is also above the first 30 weeks of 2021, when pandemic-era filings first exploded (a weekly mean of 115,846), and above the same window in 2025 (113,116). The single busiest week in the 2015–2026 extract was the week starting 11 January 2026, with 155,020 applications.
That is the headline boom. It is not the hiring boom.
The filings that look like employers have not kept up
Census does not treat every EIN application as a likely employer. High-propensity applications are those the Bureau classifies as having a high likelihood of becoming a business with payroll, based on characteristics such as corporate form, planned wages, and industry. A narrower series counts applications that indicate planned wages at filing. Corporate applications are a third cut. The three groups overlap; they are not a partition of the total, and they are still applications, not confirmed payroll births.
Against that 78 percent jump in all applications, the first 30 weeks of 2026 look different once the filter tightens:
| First 30 weeks (weekly mean) | 2019 | 2021 | 2025 | 2026 | 2026 vs 2019 |
|---|---|---|---|---|---|
| All applications | 72,603 | 115,846 | 113,116 | 129,129 | +77.9% |
| High-propensity | 27,435 | 39,647 | 35,847 | 36,770 | +34.0% |
| From corporations | 10,938 | 12,570 | 11,183 | 10,595 | −3.1% |
| With planned wages | 10,262 | 13,861 | 11,215 | 9,177 | −10.6% |
Applications that say they plan to pay wages are not merely lagging. In the matched 30-week window they are 10.6 percent below 2019 and 34 percent below 2021. Corporate applications are slightly below 2019. High-propensity filings are still up by a third from 2019, but they have slipped 7 percent from 2021 even as the all-applications count set a new high.
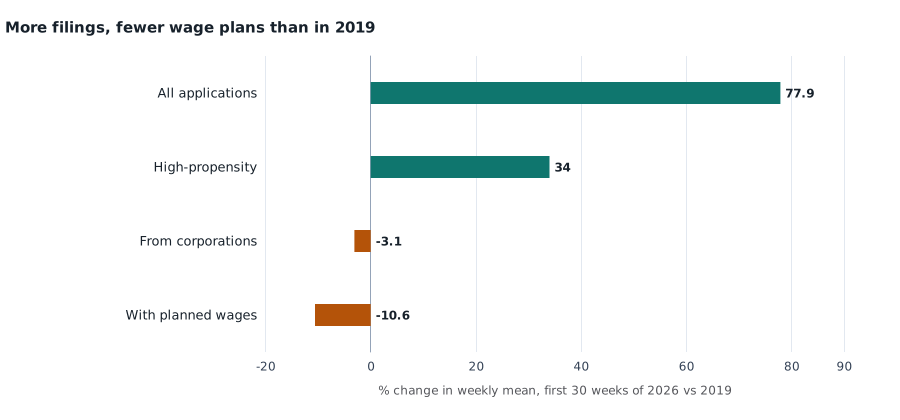
Percent change in the weekly mean of U.S. Census Bureau Business Formation Statistics applications, first 30 weeks of 2026 versus first 30 weeks of 2019. Not seasonally adjusted. Applications are EIN filings, not confirmed employer births. Source: U.S. Census Bureau, Business Formation Statistics.
The official weekly year-over-year series, which lines weeks up against the same week a year earlier, says the split was still widening in mid-summer. Over the eight weeks starting 7 June through 26 July 2026, all applications averaged 18 percent above a year earlier. Applications with planned wages averaged 20 percent below.
A smaller slice of a larger pile
Because total applications rose while wage-intent applications did not, the share of filings that look like employers has been falling for years — and 2026 is the thinnest reading in the weekly file.
In the first 30 weeks of 2015, 17.6 percent of applications indicated planned wages and 43.6 percent were high-propensity. By the same window of 2019 those shares were 14.1 and 37.8 percent. In 2026 they were 7.1 and 28.5 percent. A trailing 13-week average, which smooths weekly noise, put the planned-wages share at 6.6 percent in the week starting 26 July 2026, the lowest 13-week reading since the weekly series begins in 2015.
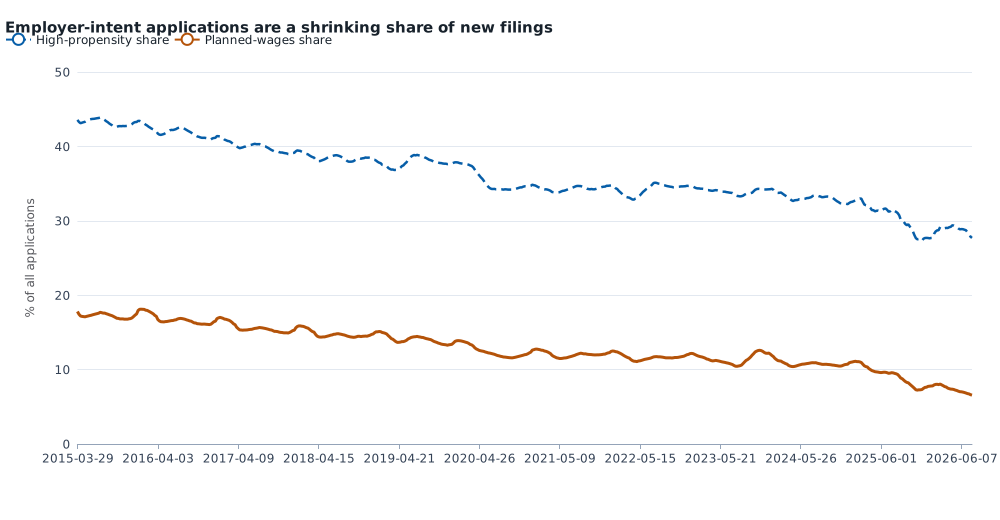
Trailing 13-week share of U.S. weekly business applications classified as high-propensity (dashed) or indicating planned wages (solid), weeks starting 29 March 2015 through 26 July 2026. Not seasonally adjusted. The two groups overlap. Source: U.S. Census Bureau.
Indexing each series to its own 2019 first-30-week mean makes the level gap visible without the scale problem of plotting 129,000 applications on the same axis as 9,000. By late July 2026, the 13-week mean of all applications was about 73 percent above that 2019 baseline. High-propensity applications were about 27 percent above. Applications with planned wages were about 20 percent below.
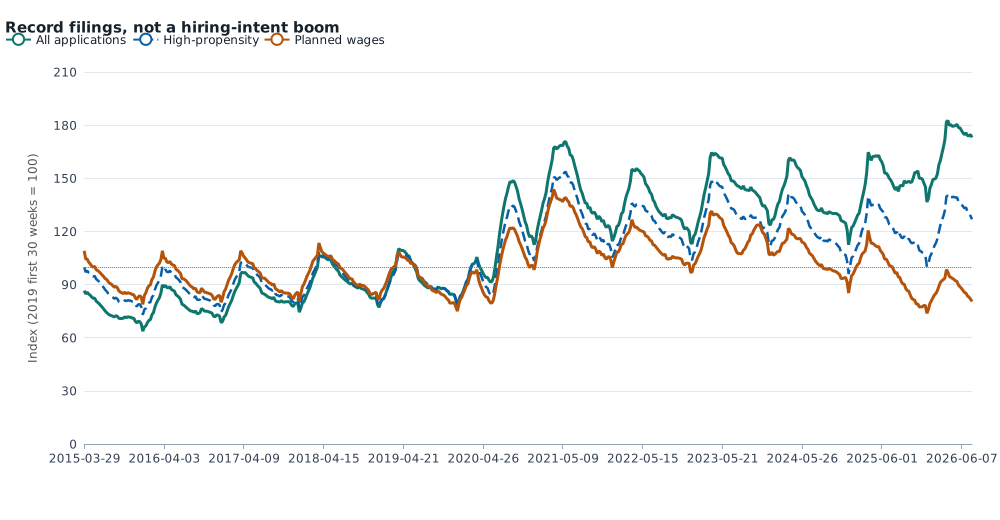
Trailing 13-week mean of weekly U.S. business applications, indexed to the first-30-week 2019 weekly mean (=100) for each series, through the week starting 26 July 2026. Not seasonally adjusted. Source: U.S. Census Bureau.
What this does — and does not — say about the gloom
The Conference Board print is a September 2026 household survey; the Census weekly file in this analysis ends with the week of 26 July–1 August. The two series do not measure the same people, and this article does not re-estimate consumer confidence, inflation, or wages. What the applications file can settle is a narrower question that the boom-versus-gloom contrast raises: has the post-2019 surge in new-business paperwork already faded, or has it continued in a form that is less about hiring?
It has continued, and it has changed shape. People are still requesting EINs at a record clip. They are less often telling Census they plan to pay wages. That is consistent with more pass-through entities, side activities, and non-employer filings — and inconsistent with a broad revival of employer startups. It cannot prove why households told the Conference Board they were gloomy, and it cannot show how many of these applications will ever have a payroll. In this data snapshot, Census’s actual “formations within four quarters” series does not reach 2026, so the employer-birth question remains open.
The practical point is still sharp. A country can set a record for business applications while the applications that look like jobs go sideways or down. That is the United States in the first seven months of 2026.
Methods and sources
This is retrospective research written on 30 September 2026 about news from 29 September 2026. It uses the pinned Census Business Formation Statistics snapshot available at research time (normalized run 2026-08-23T19-11-40Z, weekly observations from 4 January 2015 through the week starting 26 July 2026). Later releases may revise weekly counts. Observation dates are not release dates.
All application figures are weekly, not seasonally adjusted, national totals. Matched-window comparisons use each year’s first 30 observed weeks so that 2026’s partial year is not compared with a 52-week year. Percentage changes and shares are calculated from those weekly means and from trailing 13-week sums. Year-over-year rates are Census’s published weekly percent-change series, not a separate seasonal adjustment. High-propensity, planned-wages, and corporate series overlap; they are not added. Missing is not treated as zero. Conference Board index values are cited as reported in contemporaneous coverage and were not independently verified here.
Official source: U.S. Census Bureau, Business Formation Statistics, with definitions in the weekly data dictionary.
Research Date
The displayed date matches the related news edition. Research was completed 2026-09-30.
Related news: Daily · 2026-09-29
More Research
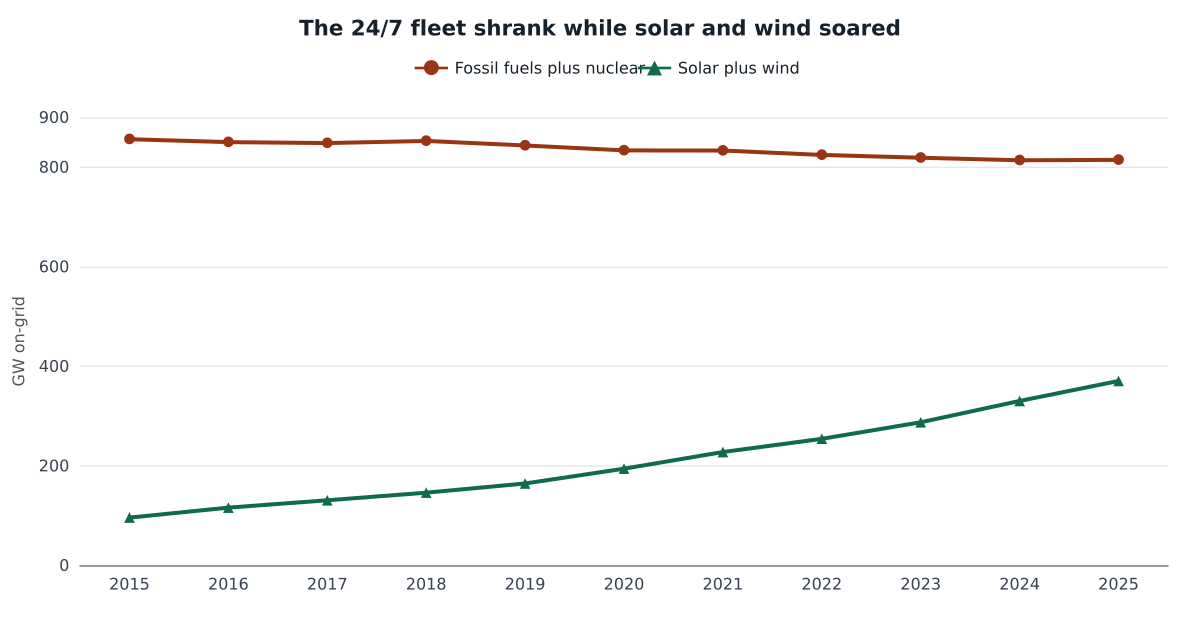
America’s Grid Grew. The Plants That Run At Night Did Not.
U.S. on-grid capacity rose 23 percent from 2015 to 2025, almost all solar and wind, while fossil-plus-nuclear plants shrank.
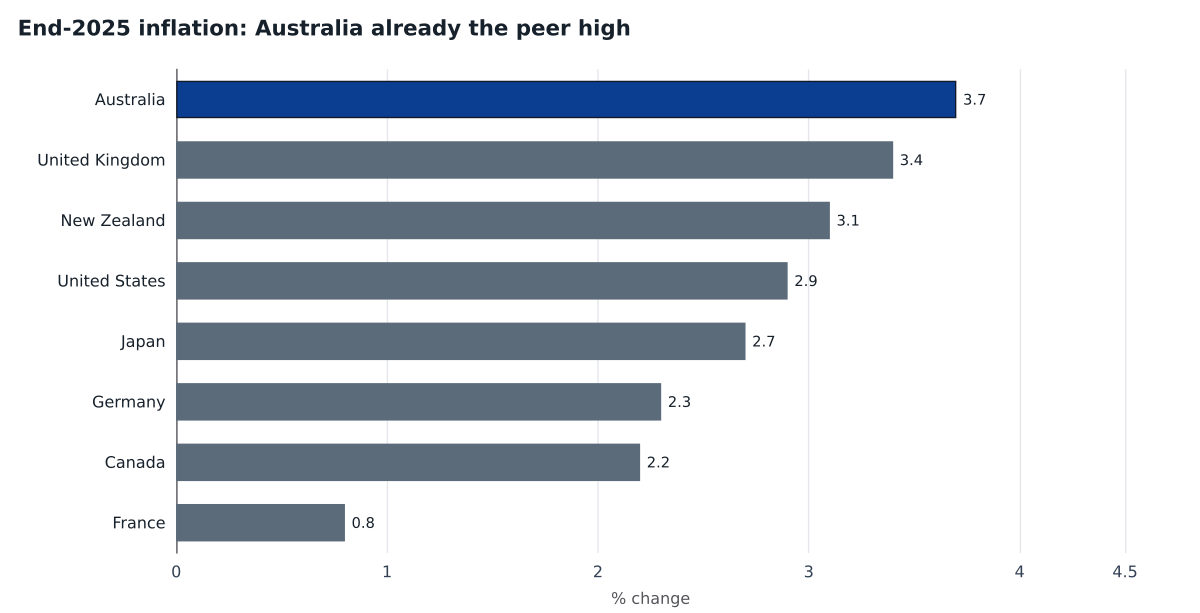
Australia’s Inflation Average Hid The Turn
IMF accounts show Australia’s inflation boom had already cooled, then end-2025 prices turned back up — the highest among large rich peers — as the cash rate was reported heading to a 15-year
The Hormuz Shock Is Priced In Brent, Not In Texas Oil
After a 2% slide on Hormuz truce talk, Brent at $104.30 is above its 2022 IMF annual average; WTI at $92.41 is not.