LunarWeave
America’s Grid Grew. The Plants That Run At Night Did Not.
When reports say data centers are being built faster than the United States can build power plants, the image is of a country that has stopped adding megawatts. That is not what the generating-capacity books show. The country has been adding a great deal of nameplate capacity. It has been adding solar farms and wind turbines. The fleet that can typically still produce electricity after dark is smaller than it was a decade ago.
That distinction matters for the projects now colliding with the grid. Dong-a Ilbo, citing Bloomberg, reported that Oracle sent a force majeure notice on Project Jupiter, a Stargate-linked data-center development, warning that power delays could push normal operation past 2028. The reporting is about a bottleneck, not about a census of plants. The census is in the International Renewable Energy Agency capacity accounts.
The megawatts arrived. They were not 24/7 plants.
From 2015 to 2025, U.S. on-grid generating capacity rose from 1,053.6 gigawatts to 1,300.4 GW, a gain of 246.8 GW, or 23 percent. Renewable capacity more than doubled, from 194.9 GW to 467.9 GW. Non-renewable capacity slipped from 858.7 GW to 832.5 GW.
Put fossil fuels and nuclear together — the plants that can usually run when the sun is down — and the picture is a slow contraction, not a buildout. That combined fleet fell from 856.1 GW in 2015 to 814.6 GW in 2025, a loss of 41.5 GW. Solar and wind together rose from 96.0 GW to 370.4 GW.
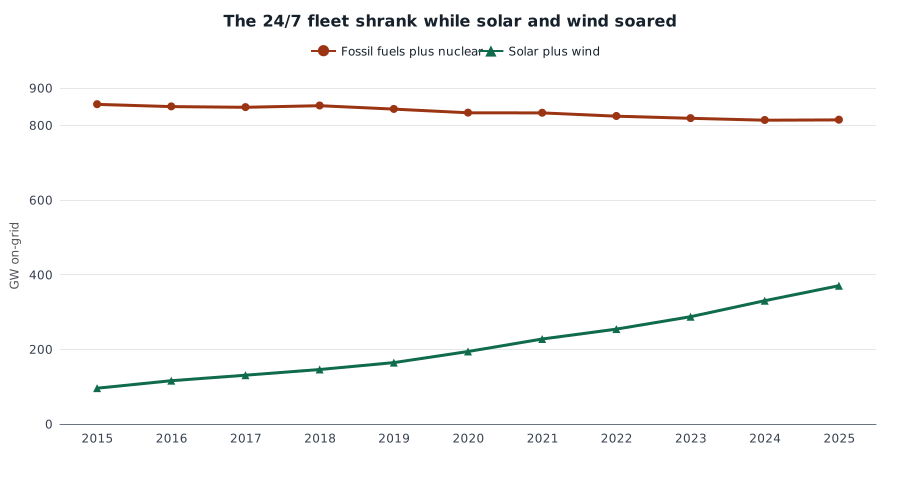
U.S. on-grid electricity generating capacity, gigawatts, 2015–2025. “Fossil fuels plus nuclear” is nameplate capacity that can typically run after dark; it is not a measure of available energy after outages or fuel constraints. Solar and wind are nameplate capacity, not the electricity they produce. On-grid only. IRENA Renewable Energy Statistics, United States.
A data center that needs power at 3 a.m. is not shopping for nameplate in the abstract. It is shopping for energy that is there when the workload is. Solar and wind are real plants. They are not substitutes, megawatt for megawatt, for a gas turbine or a reactor.
Coal left. Gas only partly replaced it. Nuclear barely moved.
The 41.5 GW decline in the fossil-plus-nuclear fleet is not a mystery. Coal capacity fell 110.2 GW, from 281.5 GW to 171.3 GW. Oil-fired capacity edged down 4.0 GW. Nuclear, still one of the densest sources on the system, went from 98.7 GW to 96.9 GW. Hydropower, the other large dispatchable renewable, was effectively unchanged at about 84 GW.
Natural gas did grow, from 439.4 GW to 513.9 GW, a 74.5 GW addition. That is a substantial build. It did not offset the coal retirements, and it has nearly stalled. Gas capacity dipped from 509.6 GW in 2023 to 508.2 GW in 2024, then recovered only to 513.9 GW in 2025. In those same two years solar added 71.7 GW and wind 11.3 GW, while the fossil-plus-nuclear fleet lost another 4.2 GW.
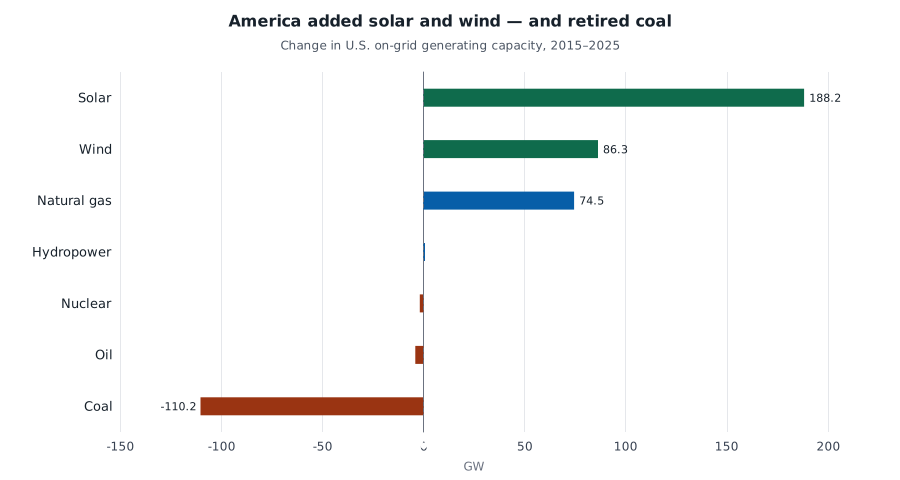
Change in U.S. on-grid generating capacity by technology, gigawatts, 2015–2025. Oil, gas and coal are components of fossil fuels and are not added to the fossil total. Nameplate capacity, not generation. IRENA, United States.
| On-grid capacity (GW) | 2015 | 2025 | Change |
|---|---|---|---|
| Solar | 23.4 | 211.6 | +188.2 |
| Wind | 72.6 | 158.8 | +86.3 |
| Natural gas | 439.4 | 513.9 | +74.5 |
| Hydropower | 83.4 | 84.1 | +0.8 |
| Nuclear | 98.7 | 96.9 | −1.8 |
| Oil | 36.6 | 32.5 | −4.0 |
| Coal | 281.5 | 171.3 | −110.2 |
| Fossil plus nuclear | 856.1 | 814.6 | −41.5 |
| Total (renewable + non-renewable) | 1,053.6 | 1,300.4 | +246.8 |
The selected technologies do not sum to the total: bioenergy, geothermal and other plants are in the total but not in every row. Oil, gas and coal do sum to fossil fuels.
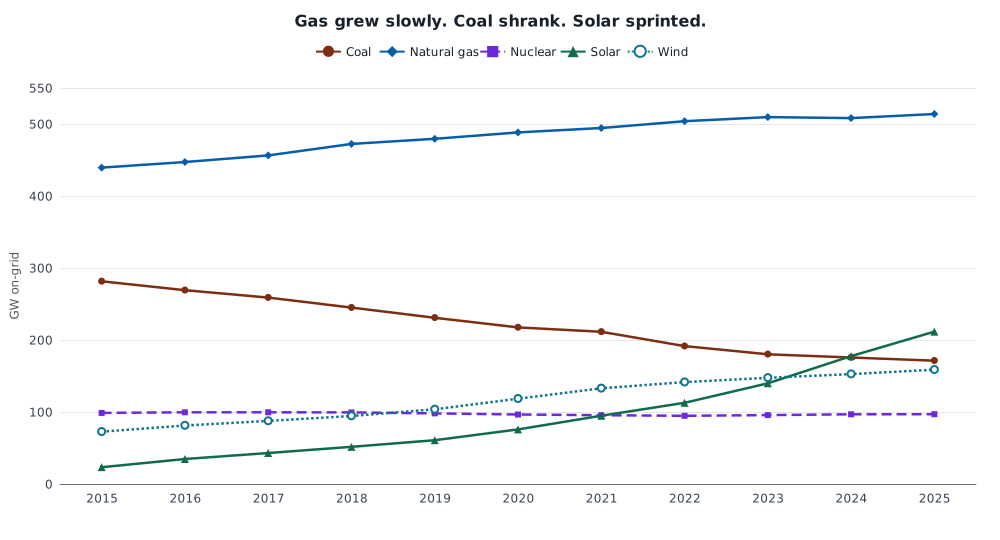
U.S. on-grid generating capacity by selected technology, gigawatts, 2015–2025. Solar here is all solar, almost entirely photovoltaics. IRENA, United States.
By 2025, fossil fuels plus nuclear were 62.6 percent of on-grid capacity, down from 81.3 percent in 2015. Gas alone was 39.5 percent of the total; solar 16.3 percent; coal 13.2 percent; wind 12.2 percent; nuclear 7.5 percent. The mix shifted toward variable plants even as the always-on stack lost ground.
A megawatt on the books is not a megawatt at 3 a.m.
Capacity is a poor scoreboard for data-center power unless it is translated into electricity. IRENA’s generation series for the United States run only through 2023, so the comparison is a year behind the latest capacity print, and using year-end capacity slightly understates output per megawatt in a year when solar was being installed quickly. Even on that conservative basis, the gap is large.
In 2023, each megawatt of on-grid solar photovoltaics produced 1.55 gigawatt-hours. Each megawatt of natural gas produced 3.66 GWh. Each megawatt of nuclear produced 8.44 GWh — about 5.5 times the solar figure. Matching 2023’s nuclear output at 2023 solar productivity would have required about 522 GW of solar PV. The country had 95.7 GW of nuclear that year, and 138.4 GW of solar PV.
Batteries, demand response and overbuilding solar can close part of that gap. None of those workarounds is in these capacity totals, and none of them shows up as a new reactor or a new combined-cycle plant. The IRENA books cannot say whether Project Jupiter will get power by 2028. They can say that the plants most able to firm a 24-hour load have not been the ones America has been installing.
The workforce that operates generating stations has not been expanding either. Bureau of Labor Statistics payrolls in electric power generation averaged 159,350 jobs in 2015 and 158,840 in 2025. By June 2026 the seasonally adjusted level was 162,100, only 3,400 above January 2015. That series counts people who run plants, not the construction crews that build them, so it is not a census of power-plant construction. It is consistent with a fleet that is changing shape faster than it is growing.
What the bottleneck is
The reported collision between data centers and the grid is easy to misread as a country that cannot add megawatts. The United States added 247 gigawatts of on-grid nameplate in a decade. Almost all of it was solar and wind. Coal left faster than gas arrived. Nuclear and hydro stood still. The always-on fleet is smaller than in 2015.
If hyperscale computing needs power that does not follow the sun, it is competing for a set of plants that has been shrinking while the solar boom has been making the capacity total look healthy. That is a more precise problem than “America cannot build power plants.” It is also harder to talk past.
Sources and methods
This is retrospective research completed on 29 September 2026, using pinned IRENA and BLS snapshots available then, not the evidence set that would have been knowable on the 28 September 2026 news day. Capacity figures are IRENA on-grid installed capacity for the United States (USA in the capacity files), 2015–2025. Generation figures use IRENA’s country generation files for “United States of America (the)” and end in 2023. Totals are renewable plus non-renewable on-grid capacity; they are not the sum of the selected technologies in the table. “Fossil plus nuclear” is an arithmetic combination of two IRENA series, not a source category. Nameplate capacity is not available energy, and 2025 capacity should not be read as 2025 generation. Payrolls are BLS Current Employment Statistics series CES4422111001, all employees in electric power generation, seasonally adjusted; the June 2026 reading is the latest in the pinned snapshot. Oracle’s force majeure notice is a reported claim from Dong-a Ilbo, not a finding from these datasets. Figures were rendered to SVG with ECharts; they were not separately checked in a browser or on a phone.
Research Date
The displayed date matches the related news edition. Research was completed 2026-09-29.
Related news: Daily · 2026-09-28
More Research
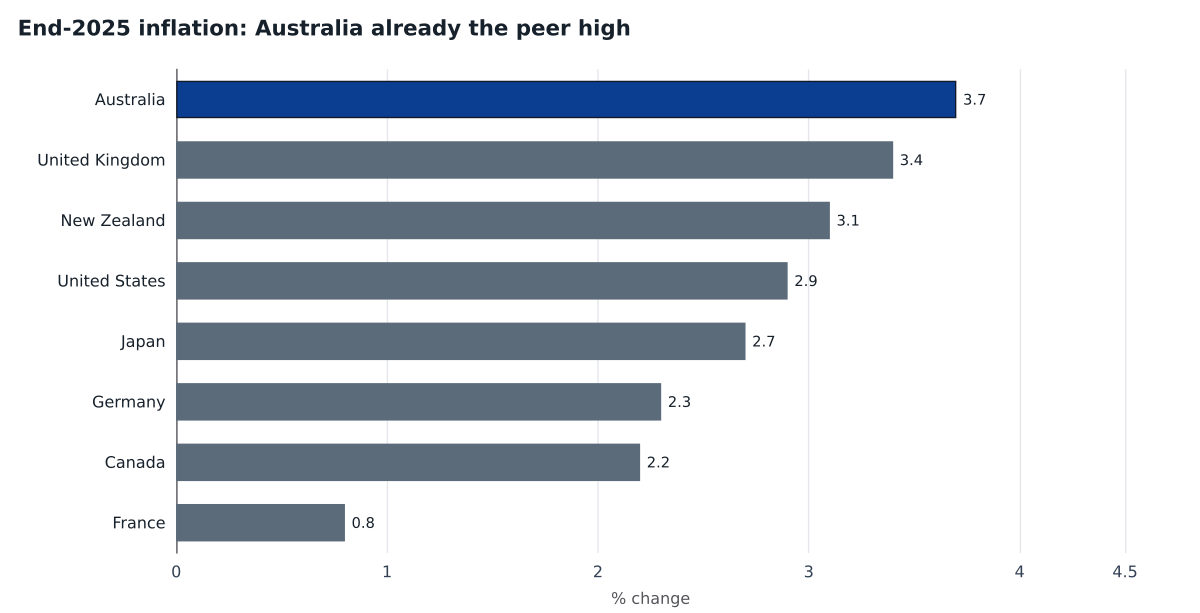
Australia’s Inflation Average Hid The Turn
IMF accounts show Australia’s inflation boom had already cooled, then end-2025 prices turned back up — the highest among large rich peers — as the cash rate was reported heading to a 15-year
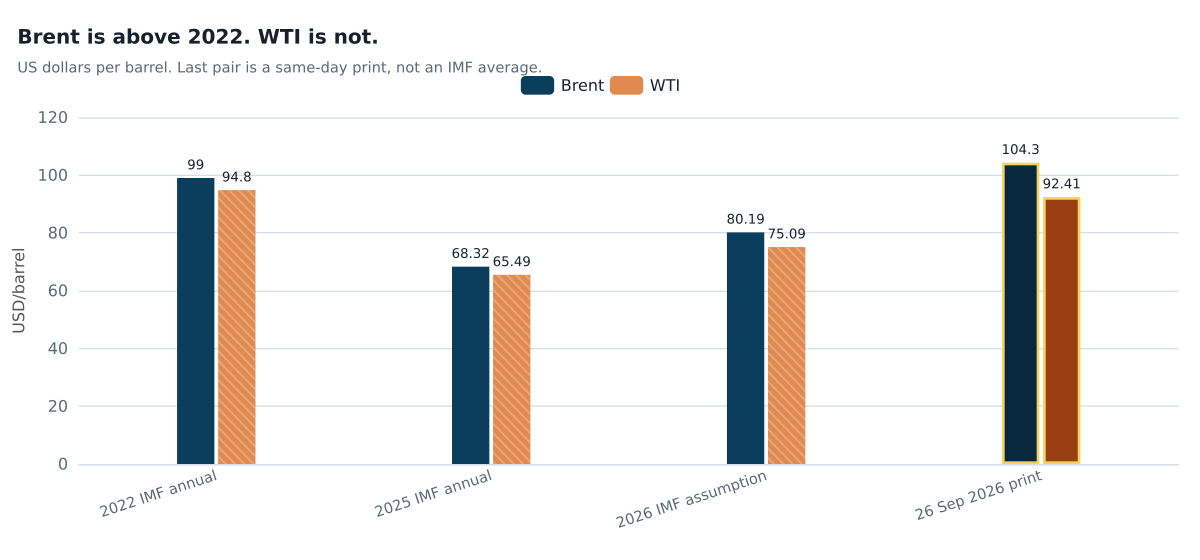
The Hormuz Shock Is Priced In Brent, Not In Texas Oil
After a 2% slide on Hormuz truce talk, Brent at $104.30 is above its 2022 IMF annual average; WTI at $92.41 is not.
The Bond Sell-Off Is Global. The Budget Holes Are Not.
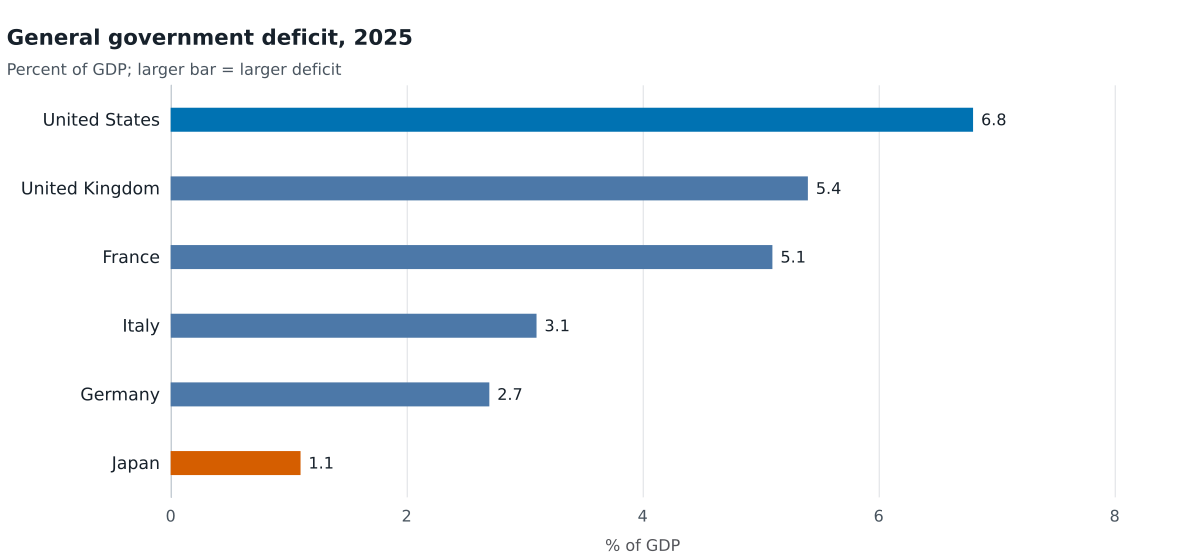
IMF 2025 books show a 6.8 percent of GDP US general-government deficit against 1.1 percent in Japan and 2.7 percent in Germany — not one ballooning-deficit bloc behind a global bond sell-off