LunarWeave
The Bond Sell-Off Is Global. The Budget Holes Are Not.
When Brent crude topped $106 a barrel after Yemen’s Houthis claimed attacks on Saudi facilities, the energy shock and the bond market seemed to tell one story. Asia Times described “bond vigilantes” on the hunt across the United States, Japan and Europe at once, “as deficits balloon, spending runs unchecked and oil prices spike.” The European Commission’s energy chief, in a letter seen by Reuters, warned of an energy-price crisis from the Iran war and urged governments to consider demand cuts.
If yields are rising together, it is tempting to conclude that the fiscal books have blown out together. They have not.
The International Monetary Fund’s World Economic Outlook still shows three different starting points, not one ballooning-deficit bloc. In 2025, the latest mostly complete year in the Fund’s books, the United States ran a general-government deficit of 6.8 percent of GDP. Japan’s was 1.1 percent. Germany’s was 2.7 percent. France and the United Kingdom sat in between, at 5.1 and 5.4 percent. Those are not market yields, and they are not proof of why bonds sold off. They are the annual borrowing flows the vigilante story is supposed to be about.
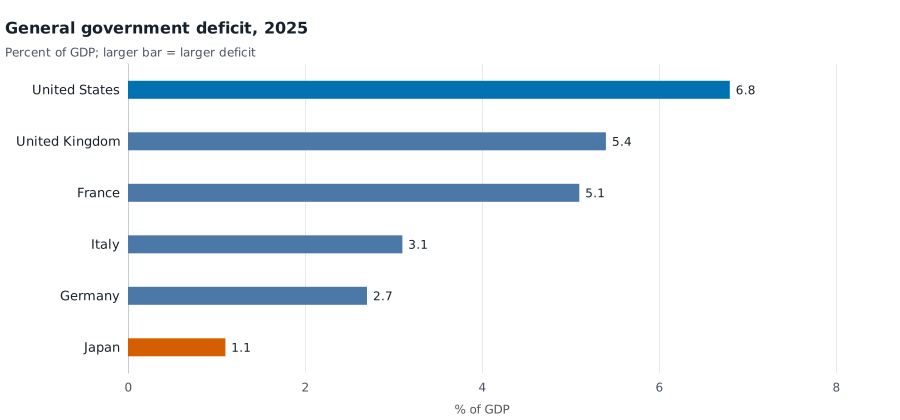
General government deficit as a share of GDP in 2025. Figures are the negative of IMF net lending/borrowing (GGXCNL_NGDP); on that page, choose the country in the chart selector. 2025 values are IMF estimates, not 2026 outcomes. Source: IMF World Economic Outlook.
The pandemic hole closed. America re-opened it.
Every large rich government on this list borrowed heavily in 2020. The United States deficit hit 14.1 percent of GDP; Britain’s 12.9 percent; Japan’s 9.0 percent; Italy’s 9.4 percent; France’s 8.9 percent. Even Germany, which had run a 1.3 percent of GDP surplus in 2019, borrowed 4.4 percent of GDP.
What happened next is the part the synchronized-panic story skips. Japan’s deficit ratio fell almost without interruption, to 1.1 percent of GDP in 2025. Italy’s stayed wide through the 2022 energy shock — 8.1 percent of GDP that year — then dropped to 3.1 percent in 2025. From 2024 to 2025 the IMF deficit ratio narrowed in the United States, Japan, France, Italy and the United Kingdom, and was unchanged in Germany.
The United States is the exception that looks like a second act. Its deficit shrank to 3.7 percent of GDP in 2022, then jumped back to 7.9 percent in 2023 and was still 6.8 percent in 2025. The IMF’s 2026 projection in this snapshot, made before the late-September oil spike, is 7.5 percent of GDP — wider again, and still the largest of the six.
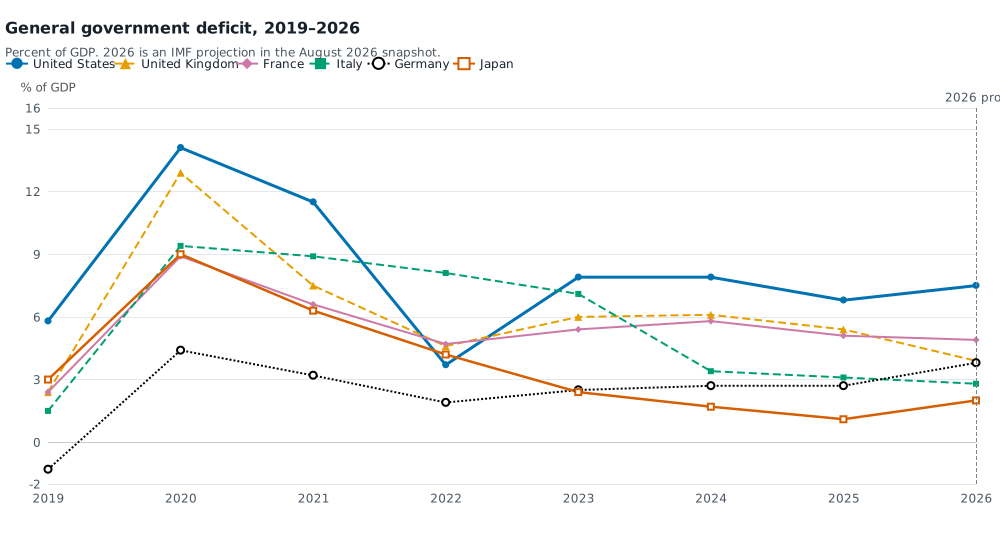
General government deficit, percent of GDP. Germany’s 2019 reading is a surplus. 2026 is an IMF projection in an August 2026 snapshot and does not incorporate later spot oil prices. Source: IMF World Economic Outlook.
“Spending runs unchecked” does not survive the same comparison. United States general-government expenditure was 35.8 percent of GDP in 2019, 44.7 percent at the 2020 peak, and 37.7 percent in 2025. That is still above the pre-pandemic ratio. It is not a return to emergency outlays. Japan’s spending share in 2025, at 36.9 percent of GDP, is almost back to 2019. Germany’s expenditure ratio did rise, from 45.5 percent of GDP in 2019 to 50.5 percent in 2025, even while its deficit stayed far smaller than America’s — a reminder that a higher spending share is not the same thing as a larger borrowing requirement.
Stock is not flow
A small annual deficit can still be a bond-market problem if the debt already on the books is huge. Japan is the clearest case. Its 2025 deficit of 1.1 percent of GDP sits on general government gross debt of 206.5 percent of GDP. Italy combines a narrowed 3.1 percent deficit with 137.1 percent debt. The United States has both a large flow and a large stock: 6.8 percent and 123.9 percent. Germany has neither by rich-country standards, at 2.7 percent and 62.9 percent.
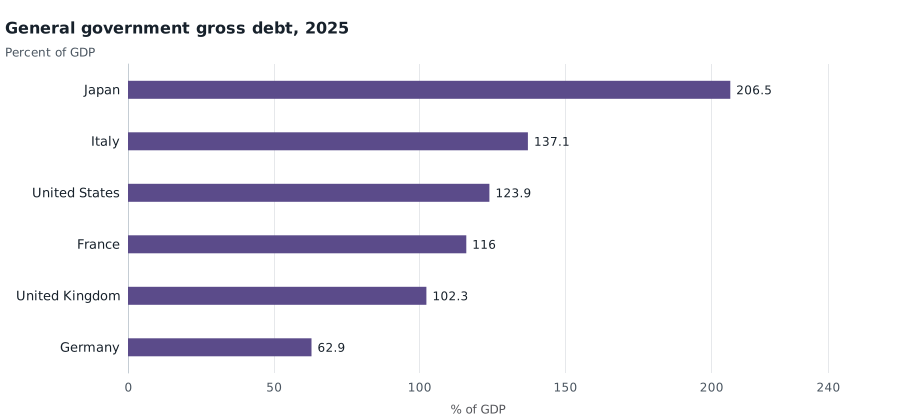
General government gross debt, percent of GDP, 2025. A 206 percent Japanese debt stock can still reprice when yields jump even if the annual deficit has almost closed. Source: IMF World Economic Outlook, GGXWDG_NGDP; on that page, choose the country in the chart selector.
That distinction matters for the oil shock. Investors can mark down long-duration debt in Tokyo without Japan having “ballooned” its deficit this year. They can mark down Treasuries because the United States is still borrowing on a 7 percent of GDP scale. Those are different fiscal facts even if the yield charts move on the same day.
| Economy | 2025 deficit, % of GDP | 2025 gross debt, % of GDP | 2025 current account, % of GDP |
|---|---|---|---|
| United States | 6.8 | 123.9 | −3.6 |
| United Kingdom | 5.4 | 102.3 | −3.1 |
| France | 5.1 | 116.0 | −0.4 |
| Italy | 3.1 | 137.1 | 1.2 |
| Germany | 2.7 | 62.9 | 4.4 |
| Japan | 1.1 | 206.5 | 4.8 |
IMF World Economic Outlook. Deficit is the negative of general government net lending/borrowing. Current account is the external balance, not the budget. 2025 figures are IMF estimates in the August 2026 snapshot.
The oil shock hits different external books
The same snapshot also shows why an energy-price crisis can still hurt Europe without a US-style budget hole. Germany’s current-account surplus (choose the country on that page) compressed from 7.9 percent of GDP in 2019 to 3.8 percent in 2022, the last $99 annual-average Brent year in these books, then recovered only to 4.4 percent in 2025. Italy swung from a surplus into a 1.8 percent of GDP current-account deficit in 2022 and was back to a 1.2 percent surplus in 2025.
The United States, by contrast, entered this shock with twin deficits: a 6.8 percent of GDP budget gap and a 3.6 percent of GDP current-account gap in 2025. Japan did the opposite, pairing its 1.1 percent budget deficit with a 4.8 percent of GDP current-account surplus. A weaker yen can still be a problem for Japanese import prices. It is not, on these figures, a twin-deficit problem.
None of this measures the September print. In the IMF snapshot used here, Brent’s 2025 annual average is $68.32 a barrel and the 2026 projection is $80.19. The 2022 average was $99.00. A $106 spot is a shock against that 2026 assumption; it is not a number in the fiscal table above. The Fund’s 2026 deficit projections — 7.5 percent of GDP in the United States, 4.9 percent in France, 3.9 percent in Britain, 3.8 percent in Germany, 2.8 percent in Italy, 2.0 percent in Japan — were written against cheaper oil than the market was quoting by late September. They also do not show a synchronized blowout.
If bond yields are rising from New York to Tokyo to Frankfurt, the common ingredient is more likely the inflation scare from oil than a sudden, shared decision to balloon the deficit. The United States is still the large-deficit outlier. Japan is a high-debt, small-deficit story. Europe is mixed: France and Britain still borrow on a 5 percent of GDP scale; Germany and Italy do not. Treating those as one hunt is a better headline than it is a fiscal fact.
Sources and methods
This is retrospective research completed on 26 September 2026. The news items are from 25 September 2026. The data are from a pinned IMF World Economic Outlook snapshot ingested on 10 August 2026 and packaged on 24 August 2026, so the 2026 oil and deficit figures are Fund projections that could not have incorporated late-September spot prices.
Deficit figures in the text and charts are the negative of IMF general government net lending/borrowing as a percent of GDP (GGXCNL_NGDP). Negative net lending is a deficit; Germany’s 2019 surplus appears as a negative deficit on the history chart. Debt is general government gross debt (GGXWDG_NGDP). The current account (BCA_NGDPD) is the external balance, not the budget. Expenditure is general government spending as a share of GDP (GGX_NGDP). Brent is the IMF annual-average series, not a daily futures print. 2025 is treated as the latest mostly complete year; 2026 and after are projections. United States deficit, debt and expenditure series in this extract begin in 2001. The comparison is six large rich economies, not the entire euro area or a GDP-weighted aggregate. The catalogue has no indexed government-bond yield series, so this article cannot measure the sell-off itself or prove what caused it. SVG charts were rendered from the data above; they have not been separately checked in a browser or on a phone.
Research Date
The displayed date matches the related news edition. Research was completed 2026-09-26.
Related news: Daily · 2026-09-25
More Research
Italy Already Rebuilt Its Power Mix. The Hole That’s Left Is Gas.
Italy’s Senate vote to return to nuclear power meets a grid that already built renewables but still generated 45% of its electricity from gas in 2023, with no IRENA nuclear series.
The Debt Staircase Is Real. It Is Not A G7 Law.
IMF general-government accounts show the post-2008 and post-2020 debt staircase in the United States, Britain and France — and a German exception that walked back down.
Bangladesh’s Factories Are Short Of Power Because The Grid Still Runs On Gas And Oil
In 2023, gas and oil generated 81.6% of Bangladesh’s electricity, versus 10.2% in Viet Nam, after national generation had already stalled.