LunarWeave
Italy Already Rebuilt Its Power Mix. The Hole That’s Left Is Gas.
Italy’s Senate has voted to let nuclear power back in. The South China Morning Post reported an 81–51 vote, with seven abstentions, on legislation that would reverse a post-Chernobyl exit. The same report said new reactors, if they come, are still years away. That delay matters more than the ceremony. A nuclear return is not a restart of a mothballed fleet. It would be an attempt to fill a hole that Italy’s electricity system has already assigned to natural gas.
IRENASTAT, the International Renewable Energy Agency’s country generation accounts, has no nuclear-generation or on-grid nuclear-capacity observations for Italy in 2000–2023. The same nuclear-generation series is populated for France, Spain, Belgium and Germany, and it is also empty for Portugal and Denmark — countries that, like Italy in this window, do not appear as nuclear producers. Empty is not a recorded zero, but it is not a hidden fleet either. The rest of Italy’s mix is fully observed, and it leaves little room for uncounted reactors: gas, coal and oil together were 96.9% of Italy’s non-renewable generation in 2023. The leftover “other non-renewable” slice was 1.7% of total output.
Gas is the leftover, not a rounding error
In 2023, the last year of complete generation figures in this snapshot, Italy generated 264,675 gigawatt-hours of electricity, taking IRENA’s total renewable and total non-renewable series together. Natural gas supplied 118,987 GWh of that, or 45.0%. Coal and peat added 5.4%, oil 3.9%. All fossil fuels together were 54.2% of generation. Renewables were 44.0%.
That gas share is not a European average. Among large peers in the same 2023 accounts, Spain’s gas share was 22.5%, Belgium’s 21.9%, Germany’s 15.8% and France’s 5.7%. Italy’s gas-fired generation, 119 TWh, was four times France’s 30 TWh — in a smaller power system.
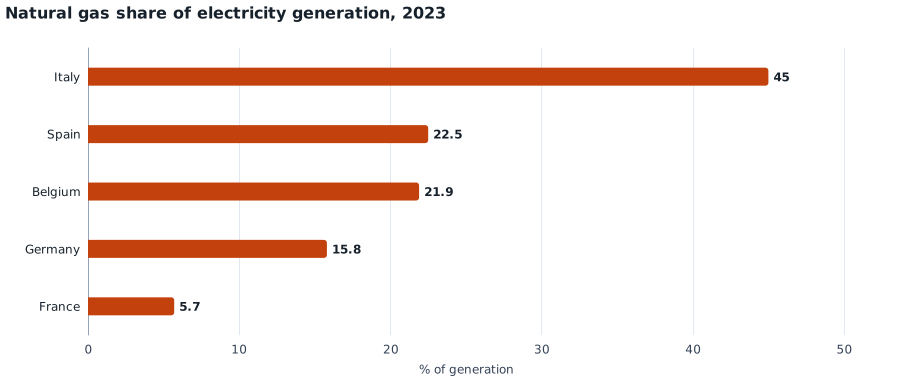
Natural gas as a share of electricity generation in 2023, percent. Generation is IRENASTAT all-grid output; the denominator is total renewable plus total non-renewable generation. Italy’s 45.0% gas share is the highest among these large European peers. Figures are annual 2023 values from an August 2026 IRENA snapshot, not 2026 output, and they measure generation mix rather than fuel imports.
Nuclear is the mirror image. France generated 338,202 GWh from nuclear plants in 2023, 64.4% of its electricity. Belgium, a much smaller system, still took 39.4% from nuclear. Spain, the better Mediterranean comparison, took 19.9% from nuclear and 50.3% from renewables. Germany’s nuclear share had already fallen to 1.4% — 7,216 GWh, down from 169,606 GWh in 2000 — as its exit reached the last plants. Italy does not appear in the nuclear series at all.
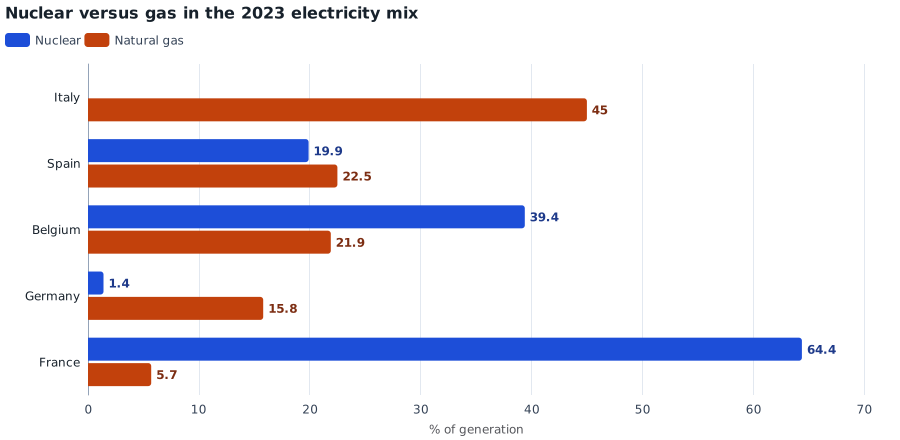
Nuclear and natural-gas shares of electricity generation, 2023, percent of renewable plus non-renewable all-grid output. Italy has no bar for nuclear because IRENASTAT contains no nuclear-generation observations for Italy in 2000–2023; that gap is not plotted as zero. France’s nuclear share is 64.4%; Italy’s gas share is 45.0%. Annual 2023 generation, not capacity or 2026 output.
The Spain comparison is the sharp one. Italy’s renewable share, 44.0%, is in the same band as Spain’s 50.3%. The difference is not that Italy failed to build solar, hydro and wind. It is that Spain still ran nuclear for about a fifth of its electricity while Italy ran more gas. On-grid nuclear capacity in the same IRENA files underscores the hardware gap: France had 61,400 MW in 2023 (and still 61,400 MW in the 2025 capacity reading), Spain 7,117 MW in 2023. Italy’s nuclear-capacity series is empty. Germany’s last reading is 4,205 MW in 2022, then the capacity series stops.
| Country, 2023 | Nuclear share | Gas share | Renewable share | Total generation (GWh) |
|---|---|---|---|---|
| France | 64.4% | 5.7% | 26.6% | 524,953 |
| Belgium | 39.4% | 21.9% | 32.8% | 83,669 |
| Spain | 19.9% | 22.5% | 50.3% | 285,923 |
| Germany | 1.4% | 15.8% | 52.8% | 511,881 |
| Italy | not in series | 45.0% | 44.0% | 264,675 |
Shares are percent of IRENASTAT all-grid renewable plus non-renewable generation. Italy’s nuclear-generation series has no rows in 2000–2023.
Oil left. Gas did not.
Italy did change. In 2000, fossil fuels were 78.7% of generation, including 31.0% oil and 11.0% coal. Renewables were only 18.4%. By 2023 oil was 3.9% and coal 5.4%. That is a real exit from oil-fired power. It is not an exit from combustible fuel.
Gas went the other way. Its share rose from 36.6% in 2000 to 45.0% in 2023, and it peaked at 55.0% in 2007, when gas generated 172,646 GWh. In 2022, during Europe’s energy-price crisis, gas was still 49.8% of Italian generation. The 2023 dip, to 45.0%, came with higher renewables and slightly lower total output; it is not evidence that gas has been displaced as the balancing fuel.
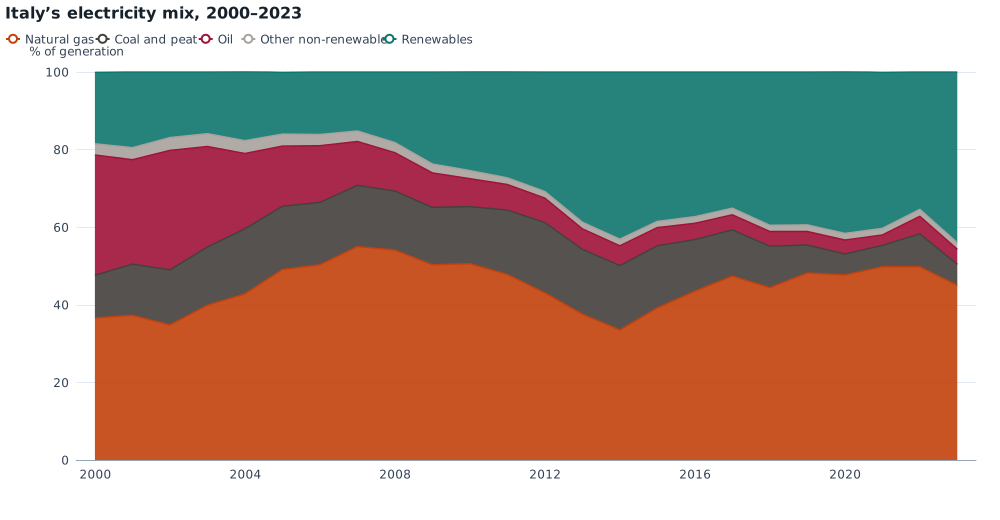
Shares of Italian electricity generation, 2000–2023, percent. Categories are natural gas, coal and peat, oil, other non-renewable residual, and total renewables. They are constructed to sum to 100 percent of IRENASTAT renewable plus non-renewable all-grid generation. Oil’s collapse and the renewable rise are visible; the gas share stays large. IRENA records no nuclear-generation series for Italy in this window. Annual data through 2023.
Inside the renewable total, the 2023 mix was already diversified: 40,517 GWh of renewable hydropower, 30,711 GWh of solar photovoltaic, 23,587 GWh of onshore wind and 5,692 GWh of geothermal. Those four technologies were about 38% of all generation; other renewables make up the rest of the 44.0% renewable share. Italy is not waiting on a first solar panel. It is waiting on a firm, non-gas source that can do what nuclear still does in France, Belgium and Spain.
Germany shows the other path through the same files. Berlin’s nuclear generation collapsed inside the data window, from 29.4% of output in 2000 to 1.4% in 2023. Germany’s 2023 renewable share, 52.8%, overtook Italy’s. Its leftover fossil generation was still 43.2% — but the bulk of that was coal, 134,892 GWh, not gas. Italy’s distinctive exposure is the opposite: a high gas share in a system that has already cut oil and grown renewables.
What a comeback would have to replace
The Senate vote is being sold as energy security. The generation accounts say what would have to change for that claim to show up in the mix. Replacing Italy’s 2023 gas-fired electricity one-for-one would mean about 119 TWh a year — more than Spain’s entire nuclear output (56,873 GWh) and more than a third of France’s nuclear output. Capacity figures make the same point in hardware: France’s 61.4 GW of nuclear plant is a standing system. Italy would be building one.
None of this says reactors will, or should, be built, or that they are the only way off gas. It does not measure pipeline imports, LNG, or the 2026 oil shock. Electricity generation is not fuel trade, and 2023 is not 2026. What the official mix can say is narrower, and more useful for a vote that will not pour concrete this year: after four decades outside nuclear, Italy’s grid is not energy-poor. It is gas-heavy. A nuclear comeback that actually moved the mix would have to take work now done by gas plants, not by a nuclear industry that does not appear in the generation record.
Sources and methods
This is retrospective research completed on 25 September 2026, after reporting of the 24 September Senate vote. It does not claim that 2023 generation figures were the public vintage on the day of the vote.
Electricity figures are annual IRENASTAT country series from the pinned snapshot compiled 24 August 2026 (IRENASTAT; generation through 2023, some capacity readings through 2025). Total generation is the sum of “Total renewable — All” and “Total non-renewable — All” electricity generation in GWh. Fossil generation is the sum of natural gas, coal and peat, and oil. Shares are percent of that total. The small “other non-renewable” residual is non-renewable minus those three fuels; it is observed, not assumed to be nuclear. Italy’s empty nuclear series is not treated as a numeric zero. The files do not record electricity trade, so a country can consume more or less than it generates. They also do not identify imported gas volumes or prices. Vote counts are from the SCMP report cited above, not from parliamentary records checked here. Charts were rendered to SVG; they have not been separately QA’d in a browser.
Research Date
The displayed date matches the related news edition. Research was completed 2026-09-25.
Related news: Daily · 2026-09-24
More Research
The Debt Staircase Is Real. It Is Not A G7 Law.
IMF general-government accounts show the post-2008 and post-2020 debt staircase in the United States, Britain and France — and a German exception that walked back down.
Bangladesh’s Factories Are Short Of Power Because The Grid Still Runs On Gas And Oil
In 2023, gas and oil generated 81.6% of Bangladesh’s electricity, versus 10.2% in Viet Nam, after national generation had already stalled.
The Diesel Crunch Is Landing On A Much Smaller US Refining Workforce
US petroleum refineries employed 61,300 people in June 2026, 61.5 percent below the 1981 peak, as diesel prices were reported at records.