LunarWeave
The Hormuz Shock Is Priced In Brent, Not In Texas Oil
Iran offered a week to reopen the Strait of Hormuz. Washington said no, and oil still fell more than 2 percent on the talk of a truce. The prints that remained after that slide were not a single “oil price.” Brent, the seaborne benchmark that prices most of the world’s waterborne crude, was $104.30 a barrel. West Texas Intermediate, the US inland grade, was $92.41.
That $11.89 gap is the story. A Hormuz fight is a fight over tankers. It should show up first in the grade that crosses oceans, not in the grade that sits in Cushing, Oklahoma. The International Monetary Fund’s annual averages, which smooth each calendar year into one number, say the same thing in a quieter way: Brent is already above its 2022 crisis-year mean. WTI is not.
Two benchmarks, usually one market
Brent and WTI are not different commodities in any useful household sense. Both are light, sweet crude. For most of the past 45 years they have moved together. In the IMF World Economic Outlook series, the average absolute gap between the two annual averages from 1980 through 2025 is $2.84 a barrel. In 26 of those 46 years WTI was slightly above Brent. A two-price oil market is the exception, not the rule.
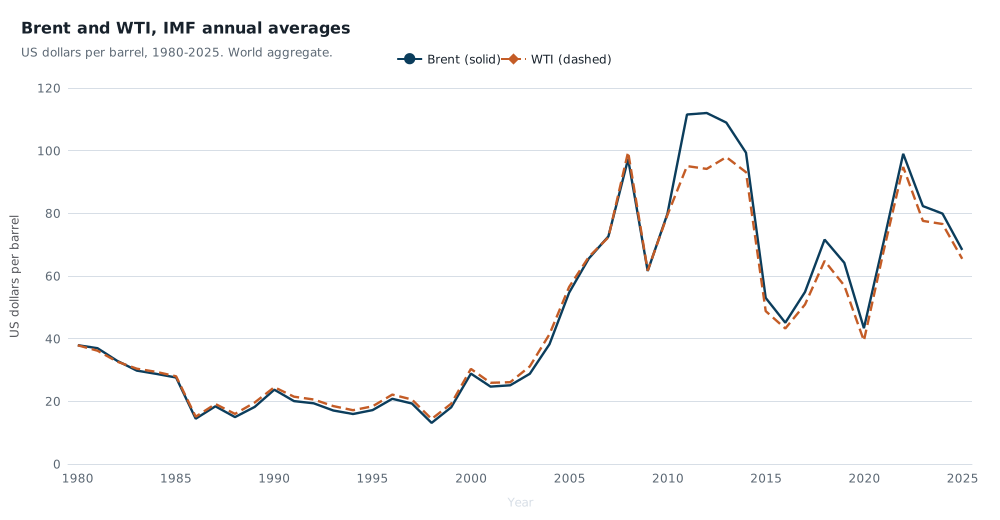
IMF World Economic Outlook annual average oil prices, US dollars per barrel, 1980–2025, world aggregate. Brent is the solid line; WTI is the dashed line. 2026–31 figures in the same snapshot are baseline assumptions and are omitted. IMF WEO.
The exception is concentrated. The only years in which the IMF’s annual Brent average exceeded WTI by $10 or more were 2011, 2012 and 2013 — $16.48, $17.83 and $11.01. Those three years sit in the US shale-boom period — a different setting from a blocked Gulf waterway. After 2013 the annual Brent premium stayed below $8: $4.20 in 2022, $4.72 in 2023, $3.30 in 2024 and $2.83 in 2025.
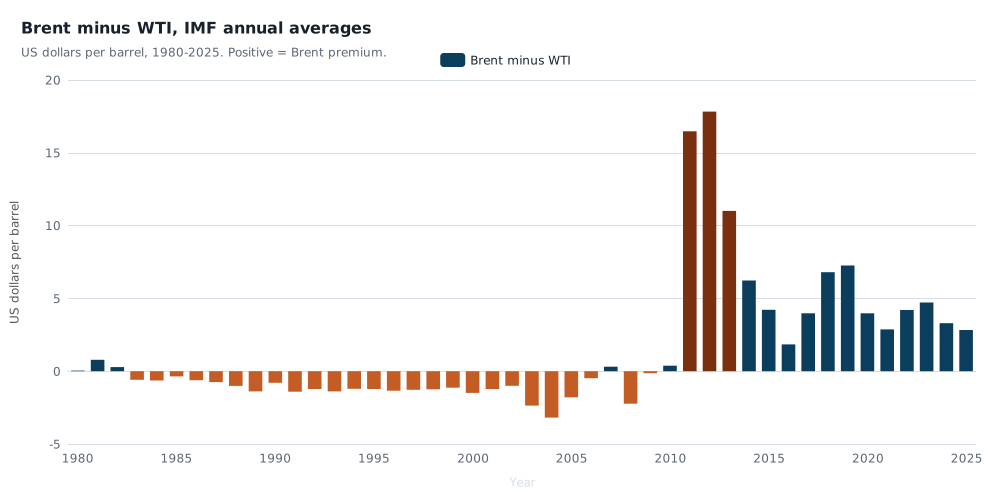
Brent minus WTI, IMF WEO annual averages, US dollars per barrel, 1980–2025. The dark bars are the only years with an annual Brent premium of at least $10. A 26 September 2026 same-day gap of $11.89 is not an annual average and is not plotted as an IMF observation.
A single day’s $11.89 spread is not the same object as a $11–18 annual spread. Prices gap intra-year and then average out. The annual record is the right comparison for a lasting two-price market, not for one session. Even with that caveat, the print is large relative to every post-2013 yearly mean, and it is large relative to 2022, when a European energy crisis and a war still left the two grades only $4.20 apart on the year.
The 2 percent slide did not unwind 2022 — except in Texas
Compare the same-day prints with the IMF’s yearly means, not with last week’s intra-day high.
| Brent | WTI | Brent minus WTI | |
|---|---|---|---|
| 2022 IMF annual average | $99.00 | $94.80 | $4.20 |
| 2025 IMF annual average | $68.32 | $65.49 | $2.83 |
| 2026 IMF baseline assumption | $80.19 | $75.09 | $5.10 |
| 26 Sep 2026 print (reported) | $104.30 | $92.41 | $11.89 |
The last row is a Times of India same-day print, not an IMF figure. A daily price can sit well above or below the average for its year. What the table can say is directional, and the direction splits.
Brent at $104.30 is $5.30 above 2022’s annual average of $99.00. Only three IMF years — 2011, 2012 and 2013 — have a higher Brent annual mean; the 2012 peak is $112.01. WTI at $92.41 is $2.39 below 2022’s annual average of $94.80. Six IMF years have a higher WTI annual mean, including 2022 itself and 2008’s $99.56 peak. The seaborne benchmark is in 2022-or-worse territory on this print. The American inland benchmark is not.
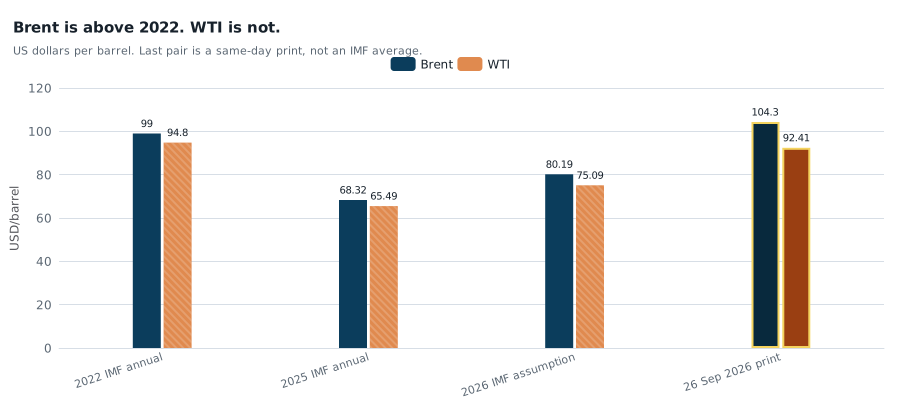
US dollars per barrel. 2022 and 2025 are IMF WEO annual averages. 2026 is the Fund’s baseline assumption in the August 2026 snapshot, not a realized yearly average. 26 September 2026 is a reported same-day print. A daily print is not comparable one-for-one with an annual average. IMF WEO; Times of India.
Both prints are still a long way above last year. Brent is $35.98 above 2025’s $68.32 annual average; WTI is $26.92 above 2025’s $65.49. A 2 percent dip on ceasefire talk is a pause in a shock, not a return to last year’s oil.
The Fund’s 2026 oil assumption has not caught the strait
The same IMF snapshot, pinned in August 2026, still assumes 2026 average prices of $80.19 for Brent and $75.09 for WTI — a $5.10 gap, in the normal post-2013 range. Those are World Economic Outlook baseline assumptions, not realized averages and not futures. They sit $24.11 and $17.32 below the 26 September prints.
That does not mean the Fund “missed” Hormuz in some scorekeeping sense. WEO oil prices for the forecast horizon are an assumption used to build the rest of the outlook, typically aligned with markets around the publication window. It does mean that anyone still treating “$80 oil” as the 2026 working number is using a baseline from before this print, and that the assumption’s modest Brent premium does not describe a $12 same-day gap.
The reported rejection of Iran’s seven-day reopening plan is political theatre until cargoes move. While they do not, the market that has to go around the strait is the one that should stay expensive. Brent is that market. WTI is a useful check on whether the United States is in the same shock. On this evidence, it is in a smaller one.
None of this prices European gas, which is a different molecule and a different crisis. None of it is a forecast that 2026 will average $104, and none of it proves that Hormuz caused the spread — only that the spread is the shape a tanker shock would have, and that the two benchmarks have rarely been this far apart once the year is averaged. US pump prices track inland crude more closely than they track a map labelled “Trump Strait.” Seaborne buyers do not have that luxury.
Sources and methods
This is retrospective research completed on 27 September 2026. The news prints are from 26 September 2026; the oil history is from a pinned IMF World Economic Outlook snapshot ingested in August 2026 (raw run 10 August 2026), which can include later revisions than were public on 26 September 2026. Observation dates are not release dates.
IMF series are POILBRE (Brent) and POILWTI (WTI), US dollars per barrel, stored on the Fund’s world aggregate (WEO group 001). Historical comparisons use 1980–2025 annual averages; 2025 is a completed calendar year in this snapshot. Figures for 2026–31 in the same file are baseline assumptions and are labelled as such. The 26 September 2026 prices are reported same-day prints, not IMF observations. SVG rendering of the charts is not a substitute for browser or mobile layout checks.
Research Date
The displayed date matches the related news edition. Research was completed 2026-09-27.
Related news: Daily · 2026-09-26
More Research
The Bond Sell-Off Is Global. The Budget Holes Are Not.
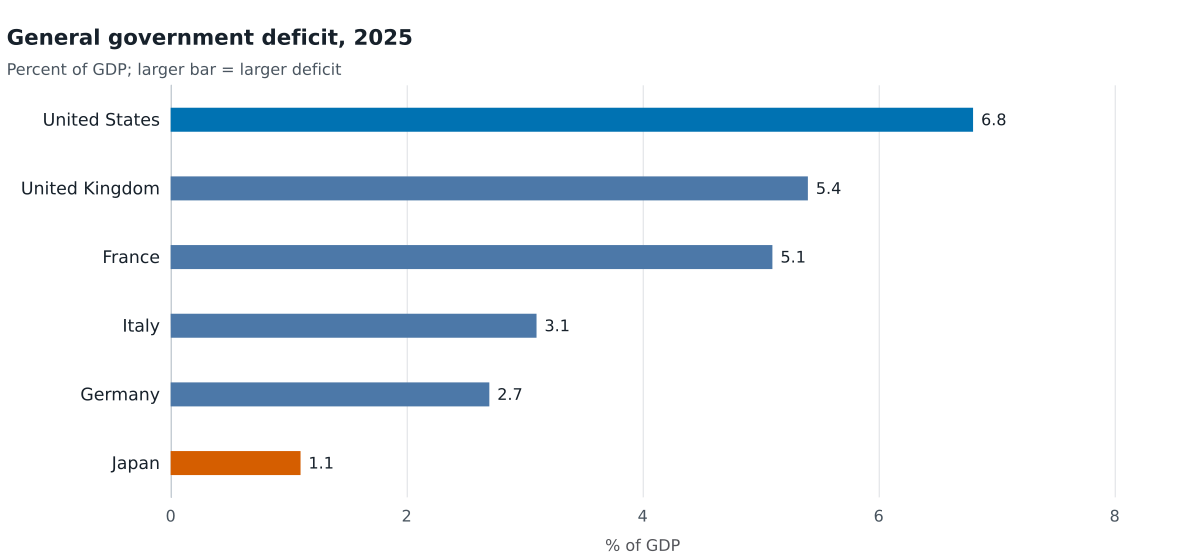
IMF 2025 books show a 6.8 percent of GDP US general-government deficit against 1.1 percent in Japan and 2.7 percent in Germany — not one ballooning-deficit bloc behind a global bond sell-off
Italy Already Rebuilt Its Power Mix. The Hole That’s Left Is Gas.
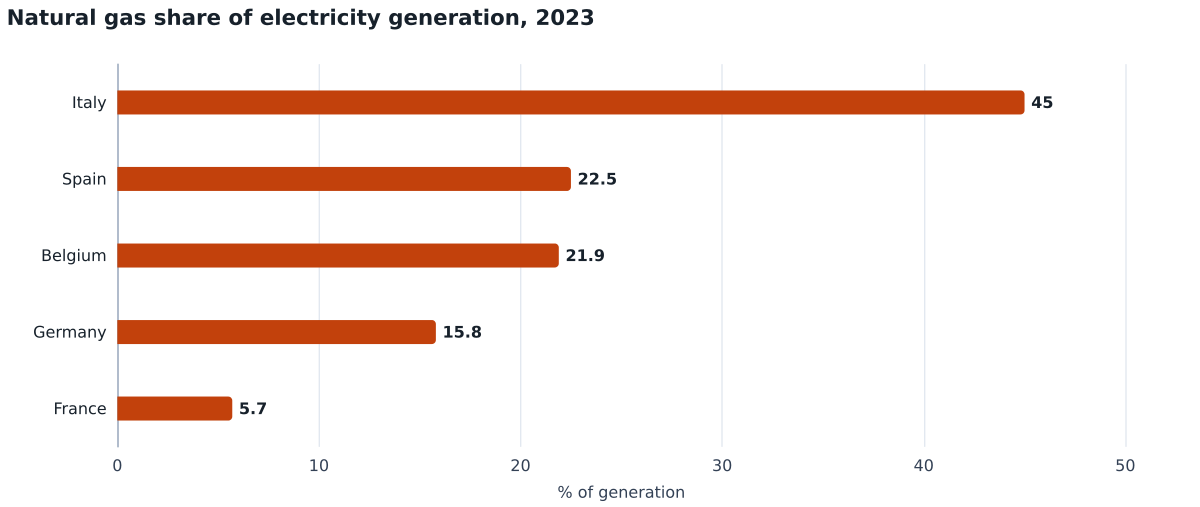
Italy’s Senate vote to return to nuclear power meets a grid that already built renewables but still generated 45% of its electricity from gas in 2023, with no IRENA nuclear series.
The Debt Staircase Is Real. It Is Not A G7 Law.
IMF general-government accounts show the post-2008 and post-2020 debt staircase in the United States, Britain and France — and a German exception that walked back down.