LunarWeave
Australia’s Inflation Average Hid The Turn
When the Reserve Bank of Australia was reported in late September 2026 to be preparing a cash-rate rise to 4.6% — the highest since 2011 — the political argument wrote itself. Households would pay more. House prices would take another knock. The implication was that demand had been left too loose.
The International Monetary Fund’s annual accounts tell a more precise story. Australia did cool. Average consumer-price inflation fell from 6.6% in 2022 to 2.9% in 2025. Real GDP growth slowed to 1.0% in 2024. Unemployment drifted up, not down. What the annual average hid is the turn at the end of the year: by December 2025, year-to-year inflation was already 3.7%, the highest among a group of large rich peers, and the Fund’s 2026 average sits at 4.0%.
That is not a picture of an economy that never left the 2022 boom. It is a picture of a cooling that reversed at the end of 2025.
The average said “job done”
The IMF’s headline inflation series is annual-average consumer prices. On that measure, Australia followed the same arc as other inflation-targeting economies after the pandemic spike. Average inflation peaked at 6.6% in 2022, eased to 5.6% in 2023 and 3.2% in 2024, and printed 2.9% in 2025 — back near the 3.4% average of 2011, the year the reported cash-rate comparison invokes.
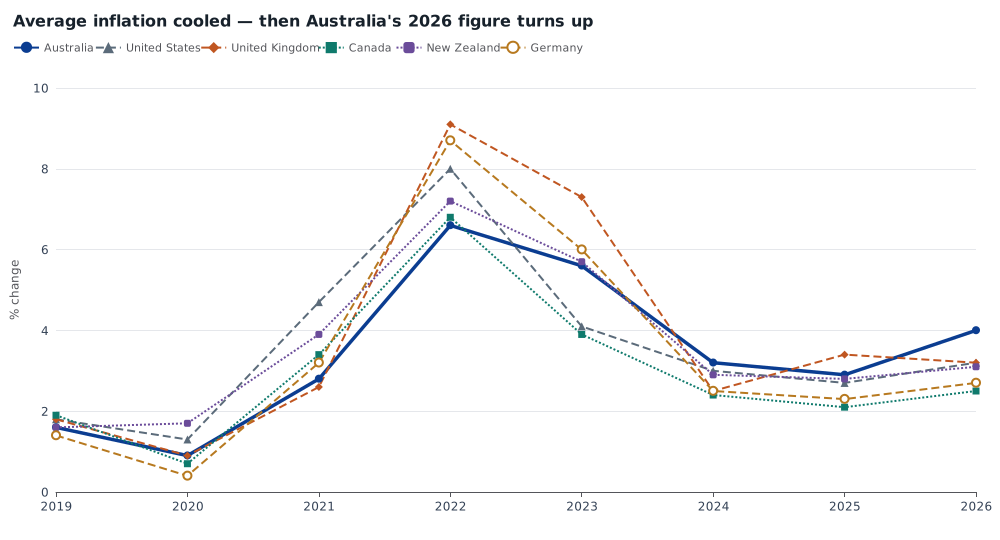
In 2025 that 2.9% average was not even the peer high. The United Kingdom’s annual average was 3.4%; Japan’s was 3.2%. Canada, Germany, the United States and New Zealand were all at or below Australia. If the only number on the table had been last year’s average, a 15-year-high cash rate would have looked late.
The 2026 figure in the same books is different. The IMF’s average inflation rate for Australia rises to 4.0%, against 3.2% in both the United States and the United Kingdom, 3.1% in New Zealand, 2.7% in Germany and 2.5% in Canada. Those 2026 readings are current-year estimates and projections in an August 2026 snapshot, not a finished annual print. They still matter, because they show the Fund already marking Australia as the inflation outlier among these peers before the latest rate decision.
December told on the average
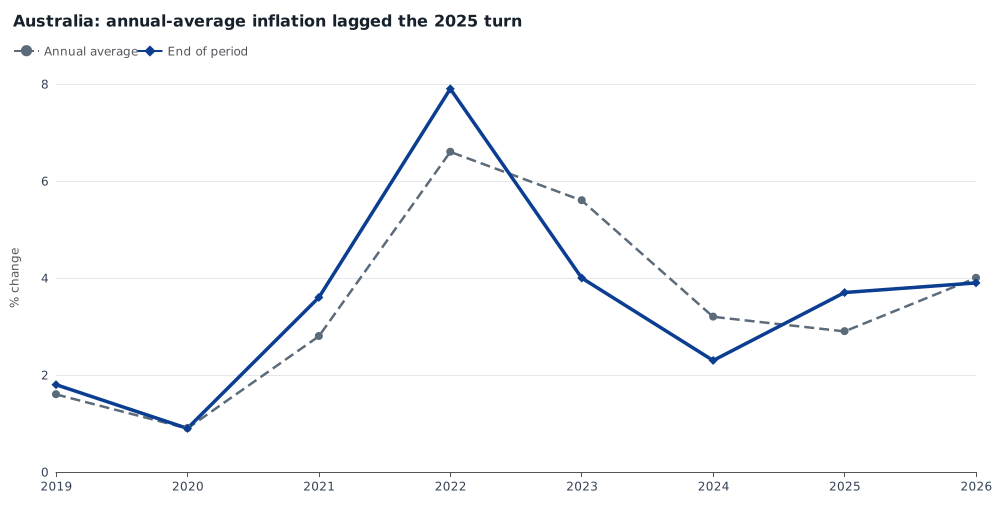
Annual averages lag turning points. The IMF also publishes end-of-period inflation — the change in consumer prices to December. In Australia those two series diverged in 2025.
End-2024 inflation was 2.3%. End-2025 inflation was 3.7%. The annual average could still fall (from 3.2% to 2.9%) because it was averaging a low start to the year with a high finish. The year-end rate had already reversed.
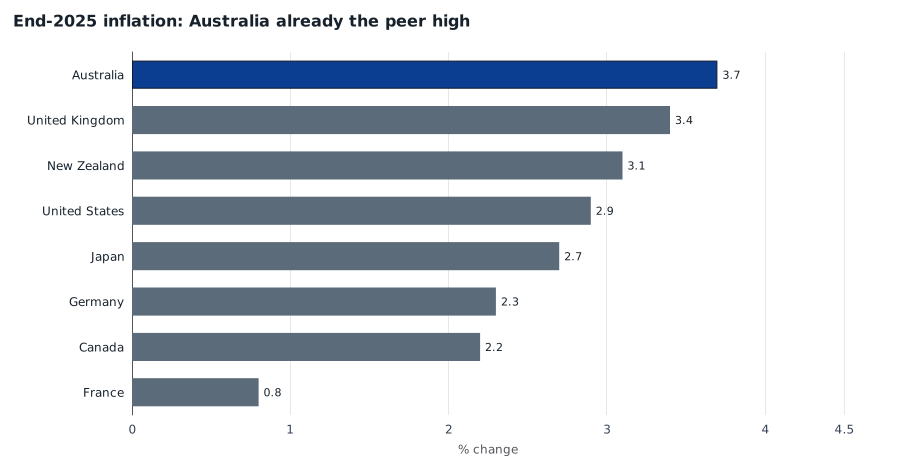
The same year-end measure puts Australia at the top of the peer group, not in the middle. Among Australia, the United States, the United Kingdom, Canada, New Zealand, Germany, Japan and France, 2025 end-of-period inflation was 3.7% in Australia, 3.4% in Britain, 3.1% in New Zealand and 2.9% in the United States. Germany was 2.3%, Canada 2.2%, Japan 2.7% and France 0.8%.
The size of the turn is also distinctive. End-of-period inflation rose 1.4 percentage points in Australia between 2024 and 2025. New Zealand and the United Kingdom each rose 0.9 points. The United States rose 0.2. Germany, Japan and France were still edging down. Whatever is lifting Australian prices at the end of the year is not a uniform rich-world rebound.
Not an overheating boom
A cash-rate rise to a 15-year high would still be easier to defend if the real economy were running hot. In the IMF’s books it is not.
Real GDP growth slowed from 4.2% in 2022 to 1.0% in 2024 and 2.0% in 2025 (the 2026 figure is also 2.0%, as a WEO projection). Unemployment rose from 3.7% in 2022 and 2023 to 4.2% in 2025. The output gap — the Fund’s estimate of how far GDP sits from potential — fell from 1.4% of potential in 2022 to 0.2% in 2025. That is essentially at capacity, not a 2022-style overshoot. In the same six-economy comparison, Britain, Canada, New Zealand and Germany were in slack in 2025; the United States was at zero.
Nor is this a classic Australian terms-of-trade blowout on the external accounts. The current-account balance swung from a 2.3% of GDP surplus in 2021 to a 2.6% deficit in 2025. A mining-boom surplus is not what the IMF is recording.
| Economy | Average CPI 2025 | End-2025 CPI | Average CPI 2026* | Real GDP 2025 | Unemployment 2025 | Output gap 2025 |
|---|---|---|---|---|---|---|
| Australia | 2.9 | 3.7 | 4.0 | 2.0 | 4.2 | 0.2 |
| United States | 2.7 | 2.9 | 3.2 | 2.1 | 4.3 | 0.0 |
| United Kingdom | 3.4 | 3.4 | 3.2 | 1.3 | 4.9 | −0.6 |
| New Zealand | 2.8 | 3.1 | 3.1 | 0.2 | 5.3 | −1.5 |
| Canada | 2.1 | 2.2 | 2.5 | 1.7 | 6.9 | −0.9 |
| Germany | 2.3 | 2.3 | 2.7 | 0.2 | 3.8 | −1.1 |
*2026 average CPI figures are IMF current-year estimates/projections. Inflation in percent change; unemployment in percent of the labour force; output gap in percent of potential GDP. Figures rounded to one decimal place.
The comparison is not a ranking of central-bank mistakes. New Zealand’s growth had already stalled. Germany’s output gap was negative. Australia is the economy in this group that cooled without falling into slack — and then saw year-end inflation turn up anyway.
What the books cannot settle
None of this measures the cash rate, mortgage repayments or house prices. Those remain reporting claims about the Reserve Bank’s decision, not IMF observations. The Fund’s inflation series are annual, not monthly CPI prints, and they do not identify whether the 2025 year-end turn came from rents, insurance, fuel or something else. A 0.2% of potential output gap is an estimate, not a thermometer.
The practical conclusion is narrower, and still useful. If the cash rate does go to 4.6%, it is hard to read that as punishment for a boom that never ended. In the IMF’s accounts the boom ended. Average inflation came down. What did not stay down was inflation at the end of 2025, where Australia was already the peer high, with 2026 marked higher still.
That is a harder problem than leftover demand. It is also the one the annual average, taken alone, would have missed.
Methods and sources
This is a retrospective analysis of a 27 September 2026 news cycle, written on 28 September 2026 using a pinned IMF World Economic Outlook snapshot created on 24 August 2026 (raw extract 10 August 2026). Later data releases may revise these figures. Observation dates are not release dates; 2026 values in this vintage include staff estimates and projections.
Inflation is IMF average consumer prices (PCPIPCH) and end-of-period consumer prices (PCPIEPCH), both percent change. Real GDP is constant-price percent change (NGDP_RPCH). Unemployment is the IMF labour-force rate (LUR). The output gap is percent of potential GDP (NGAP_NPGDP). The current account is percent of GDP. Peer economies were chosen as large rich inflation-targeting comparators; they are not a complete OECD sample. Percentages in the prose and table are rounded to one decimal place from the saved extracts. Charts were rendered to SVG; they have not been separately checked in a browser.
Official source: IMF World Economic Outlook. Linked MacroVedia pages show the same IMF series across countries; select Australia in the chart. Reporting on the expected cash-rate rise: The Guardian.
Research Date
The displayed date matches the related news edition. Research was completed 2026-09-28.
Related news: Daily · 2026-09-27
More Research
The Hormuz Shock Is Priced In Brent, Not In Texas Oil
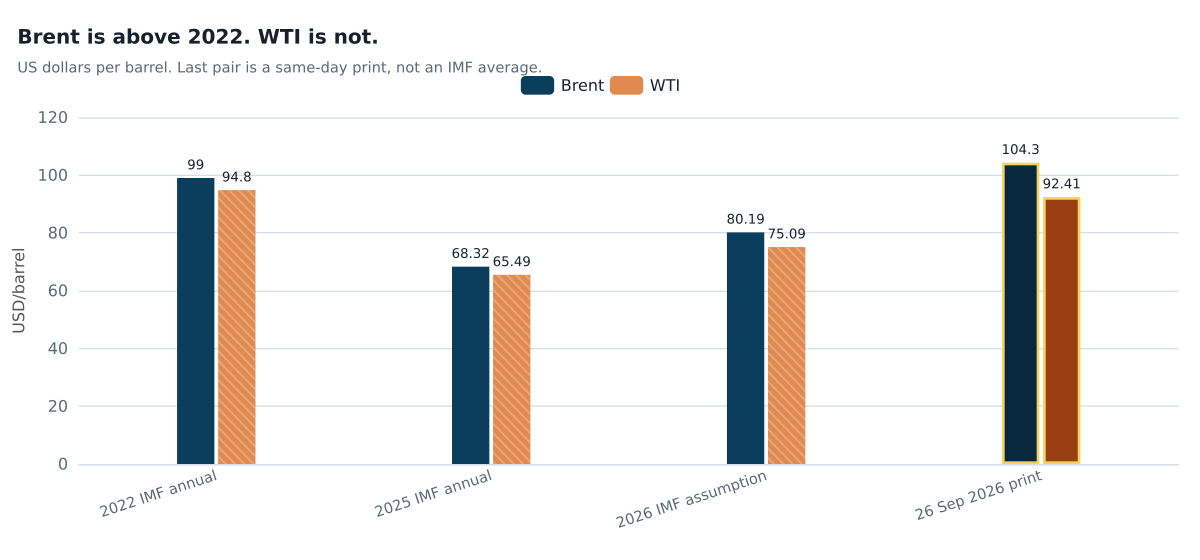
After a 2% slide on Hormuz truce talk, Brent at $104.30 is above its 2022 IMF annual average; WTI at $92.41 is not.
The Bond Sell-Off Is Global. The Budget Holes Are Not.
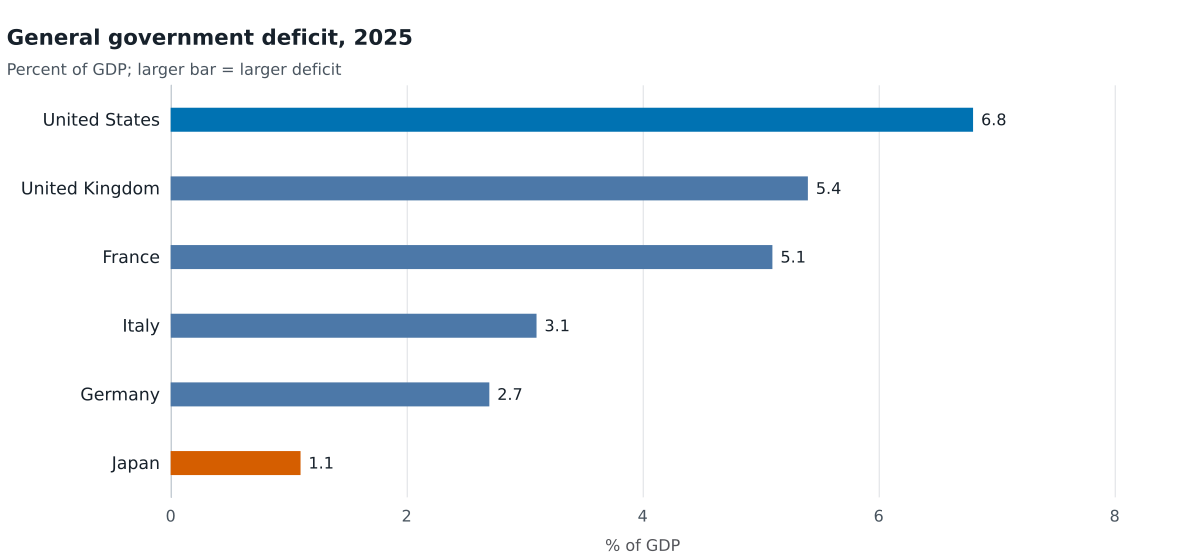
IMF 2025 books show a 6.8 percent of GDP US general-government deficit against 1.1 percent in Japan and 2.7 percent in Germany — not one ballooning-deficit bloc behind a global bond sell-off
Italy Already Rebuilt Its Power Mix. The Hole That’s Left Is Gas.
Italy’s Senate vote to return to nuclear power meets a grid that already built renewables but still generated 45% of its electricity from gas in 2023, with no IRENA nuclear series.