LunarWeave
Ukraine Is Heading Into Winter With A Third Less Electricity Than Before The Invasion
When Russian missiles and drones hit Kyiv’s energy infrastructure at the start of October, they were not striking a power system that had climbed back to its pre-war size. Media Indonesia reported four people killed and the threat of a winter electricity crisis. A drone also struck a nuclear research institute that houses a research reactor; the fire was extinguished and no one was injured, the Kyiv Independent reported.
The question that matters for the heating season is not whether any single night of attacks was large. It is whether Ukraine still generates enough electricity for a wartime economy that has begun to stabilize — or whether later winters are landing on a grid that had already shrunk.
Annual figures from the International Renewable Energy Agency show that it had. Ukraine generated 157.6 terawatt-hours of electricity in 2021, the last full year before the full-scale invasion. In 2023, the latest year in IRENA’s generation accounts, output was 101.1 TWh, 35.9 percent lower. The 2022 collapse, to 108.7 TWh, moved with the economy. The 2023 sequel did not.
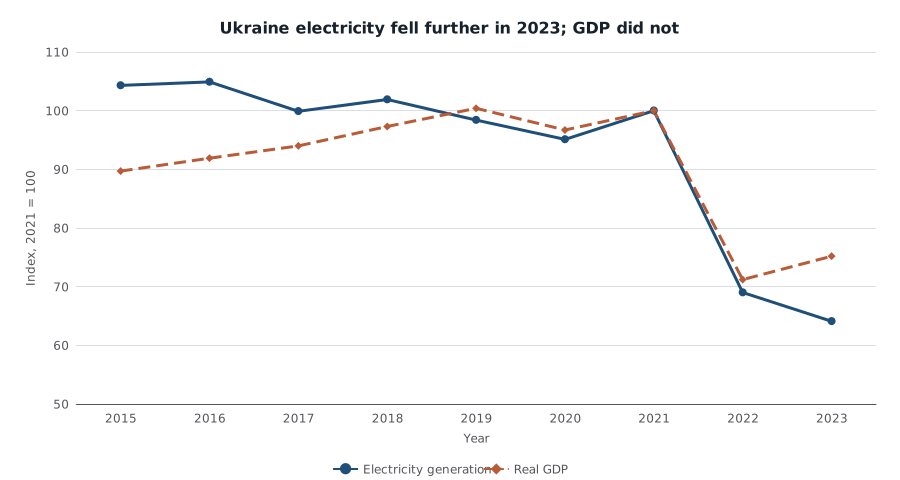
Ukraine electricity generation and real GDP, indexed to 2021 = 100. Electricity is annual generation from IRENA (total renewable plus total non-renewable). Real GDP is IMF World Economic Outlook constant-price GDP in national currency. Generation observations end in 2023.
IMF figures for real GDP growth show a 28.8 percent contraction in 2022 and a 5.5 percent rebound in 2023. Constant-price GDP was still 24.8 percent below 2021. Electricity kept falling in 2023, by another 7.1 percent. Indexed to 2021, generation was at 64 and real GDP at 75. A recovering economy on a shrinking power system has less slack when the next winter campaign begins.
Those generation numbers stop in 2023. They cannot measure the 2024 and 2025 attack seasons, let alone October 2026. They describe the baseline those later winters inherited.
Nuclear still carries half the system — after losing two-fifths of its output
Nuclear plants supplied 86.2 TWh in 2021, 54.7 percent of generation. By 2023 they supplied 52.0 TWh, 51.4 percent of a smaller total. That is a 39.7 percent decline in nuclear output, close to the fall in coal-and-peat generation, from 36.5 TWh to 22.8 TWh.
IRENA still records 13,835 MW of on-grid nuclear capacity in every year from 2021 through 2025. Nameplate capacity did not fall. Generation did. The statistics cannot identify which reactors were occupied, damaged, or offline, and they should not be read as proof that 13.8 GW is available to the government-controlled grid. They do show that Ukraine’s missing nuclear megawatt-hours are not recorded as a retirement of the fleet.
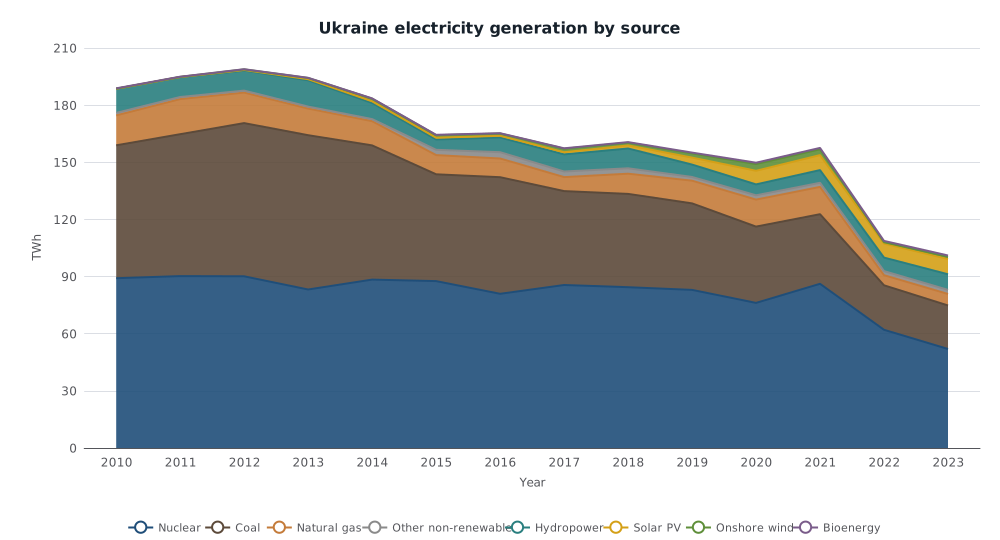
Annual electricity generation in Ukraine by source, terawatt-hours, 2010–2023. Stacked series are IRENA country generation figures. Total equals IRENA total renewable plus total non-renewable. Other non-renewable is oil plus a small residual inside non-renewable generation.
Gas-fired generation fell harder than coal: 14.3 TWh in 2021, 6.0 TWh in 2023, a 57.9 percent drop. Onshore wind fell 63.5 percent, from 3.0 TWh to 1.1 TWh. Solar photovoltaic output held up, from 7.9 TWh to 8.0 TWh. Hydropower rose from 6.7 TWh to 8.2 TWh, a rebound from a weak 2021 rather than a new high — 2018 output was 10.4 TWh. All renewables together were 18.3 TWh in 2021 and 18.1 TWh in 2023, essentially unchanged, while nuclear and fossil output collapsed underneath them.
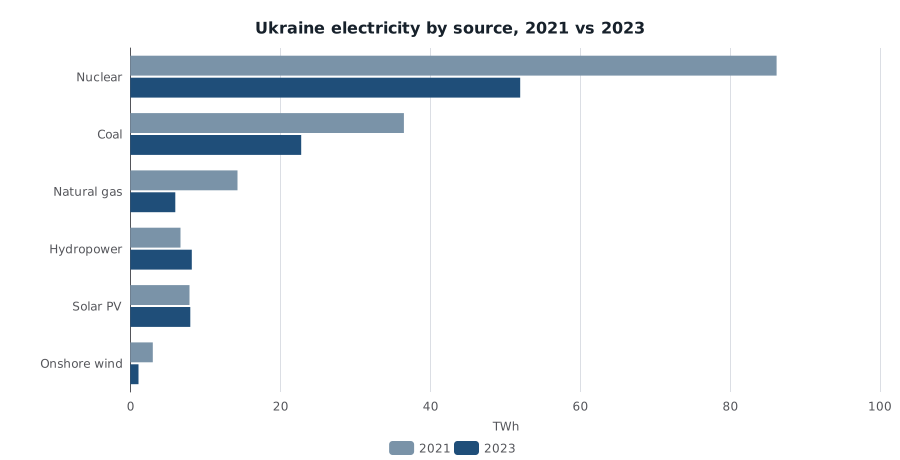
Ukraine electricity generation by source in 2021 and 2023, terawatt-hours. IRENA country generation, all-grid.
| Source | 2021 (TWh) | 2023 (TWh) | Change |
|---|---|---|---|
| Total generation | 157.6 | 101.1 | −35.9% |
| Nuclear | 86.2 | 52.0 | −39.7% |
| Coal and peat | 36.5 | 22.8 | −37.5% |
| Natural gas | 14.3 | 6.0 | −57.9% |
| Hydropower | 6.7 | 8.2 | +23.0% |
| Solar PV | 7.9 | 8.0 | +2.5% |
| Onshore wind | 3.0 | 1.1 | −63.5% |
| All renewables | 18.3 | 18.1 | −1.3% |
A drone strike on a research reactor is a radiological scare, not a substitute for the missing terawatt-hours. The electricity Ukraine lost after 2021 came from the plants that used to fill ordinary winter demand: nuclear units that remained on the capacity books but produced much less, coal plants that kept sliding, and gas and wind that were cut roughly in half or worse.
Capacity was rewritten in 2024. Generation cannot yet confirm it.
IRENA’s capacity file, which runs through 2025, shows a break that generation cannot yet test. On-grid fossil capacity is recorded at 28,664 MW every year from 2020 through 2023, then 3,375 MW in 2024 and 2025 — an 88.2 percent reduction. The 2024 fossil total matches the 2,500 MW of coal plus 875 MW of gas in those years. Hydropower capacity is cut from 4,488 MW in 2023 to 1,250 MW in 2024; solar from 8,062 MW to 5,500 MW. Nuclear is not revised.
Those 2024 figures may mix destroyed plants, occupied territory, and a change in what IRENA counts as operable stock. They are not a plant-level damage survey, and this snapshot has no 2024 generation number to show how much output followed the write-down. Taken at face value, they say the thermal fleet that used to back up nuclear in winter was largely removed from the capacity account before the 2026 heating season. That reading should stay provisional until generation catches up.
What the next winter is landing on
The October attacks matter because the buffer was already gone. By 2023 Ukraine was producing 35.9 percent less electricity than in 2021, with nuclear still about half of what remained and thermal output down sharply. Real GDP had started to grow again. The grid had not. Later winters of attacks are not in these generation numbers; they can only have made a tight system tighter.
Sources and methods
This is retrospective research completed on 2 October 2026, using pinned IRENA and IMF snapshots dated 24 August 2026. It is not a reconstruction of what was knowable on 1 October 2026. Electricity figures are IRENA country generation in gigawatt-hours, converted to terawatt-hours by dividing by 1,000; the annual total is IRENA’s total renewable series plus total non-renewable series. Capacity is IRENA on-grid megawatts. Real GDP is the IMF World Economic Outlook constant-price series in national currency and its percentage-change companion; 2025–2027 values are treated as projections, and 2024 may still be an estimate. IRENA generation ends in 2023. Browser and mobile layout of the charts were not separately tested beyond SVG rendering.
Research Date
The displayed date matches the related news edition. Research was completed 2026-10-02.
Related news: Daily · 2026-10-01
More Research
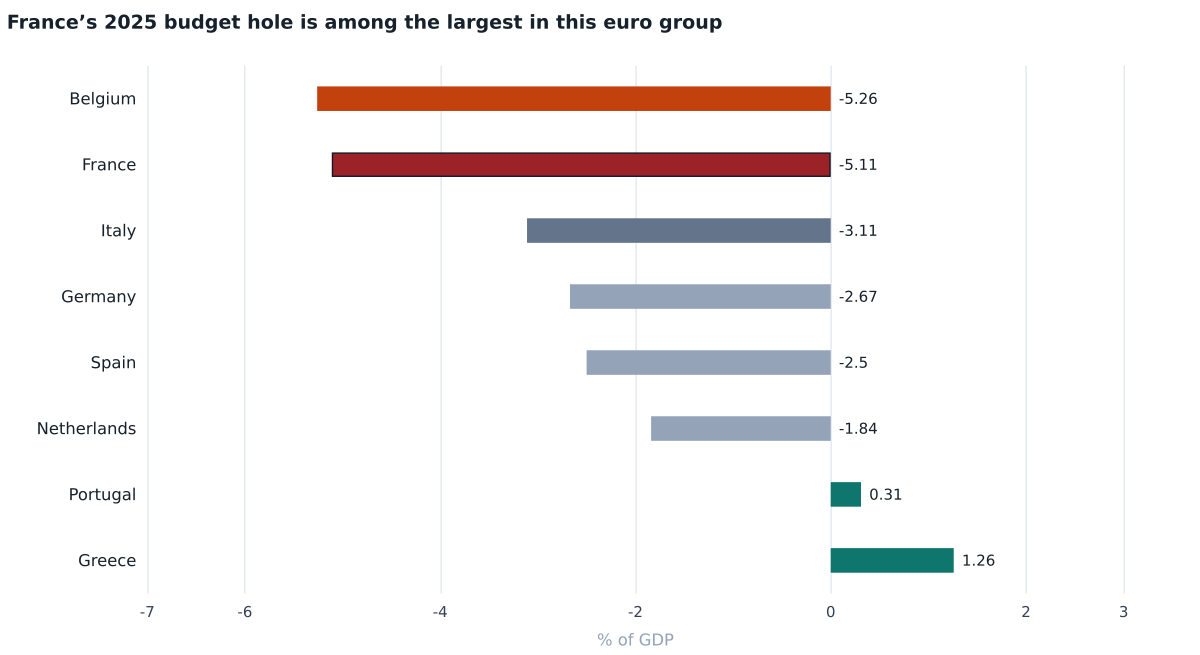
France Still Owes Less Than Italy. Its Budget Has Not Closed.
IMF figures show France’s public debt still below Italy’s and Greece’s. The open 5% of GDP deficit is why the ratio is still rising.
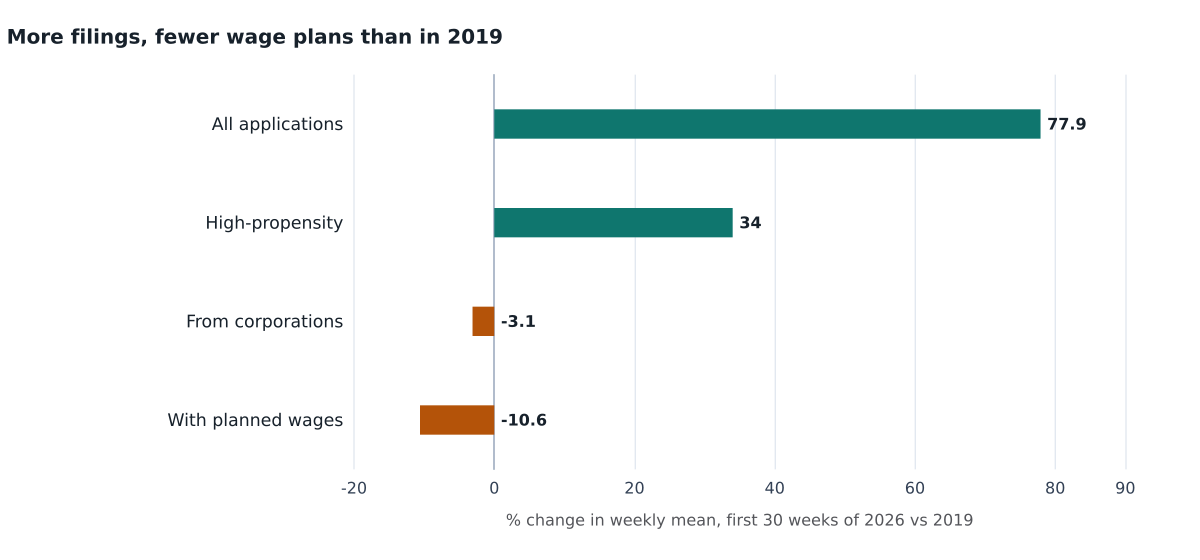
Americans Are Filing More Businesses. They Are Not Planning To Hire.
Census weekly EIN filings ran 78 percent above 2019 in early 2026, but applications that indicated planned wages were 11 percent lower.
America’s Grid Grew. The Plants That Run At Night Did Not.
U.S. on-grid capacity rose 23 percent from 2015 to 2025, almost all solar and wind, while fossil-plus-nuclear plants shrank.