LunarWeave
The Oil Shock Is Not A U.S. Oil-Jobs Boom
When Iran and the United States traded strikes again in late July, the oil market did what traders expect. Barron's reported ExxonMobil and Chevron shares rising with the crude spike. A market note published the same day asked whether the Federal Reserve would treat a more-than-20-percent jump in oil — a move the authors tied to the Iranian conflict, not to domestic demand — as an inflation signal rather than geopolitical noise.
What the price tape does not show is the American oil workforce. If this were 2014, a sustained oil shock would have been a hiring story in the Permian as much as a pump-price story. It is not 2014.
Seasonally adjusted payrolls in oil and gas extraction stood at 114,600 in July 2026, according to the U.S. Bureau of Labor Statistics Current Employment Statistics. That is 86,200 jobs, or 43 percent, below the October 2014 peak of 200,800. The industry has barely climbed off its November 2021 trough of 110,900. From January 2025 through July 2026, extraction payrolls drifted down, from 119,800 to 114,600. The first seven months of 2026 added no boom. They subtracted jobs.
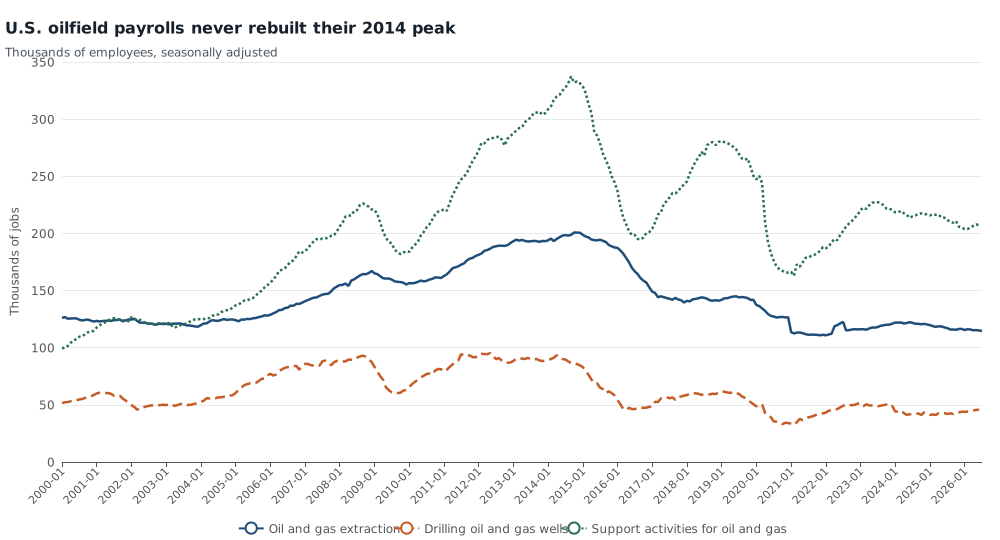
Seasonally adjusted U.S. payroll employment, in thousands of jobs, for oil and gas extraction, drilling oil and gas wells, and support activities for oil and gas operations, January 2000 through the latest month in the August 24, 2026 CES snapshot (July 2026 for extraction; June 2026 for drilling and support). June and July 2026 figures are preliminary. The series are not barrels of oil produced. Source: U.S. Bureau of Labor Statistics, Current Employment Statistics.
The rest of the oilfield looks the same. Drilling oil and gas wells employed 45,800 people in June 2026, 52 percent below the May 2012 peak of 95,300. Support activities for oil and gas operations — well servicing, site work, and related services, and the largest of the three payrolls — employed 207,200, 39 percent below September 2014. Those three industries do not overlap in the CES classification. Added together, they employed 368,100 people in June 2026, against 622,800 at the September 2014 combined peak: 254,700 fewer jobs, a 41 percent gap.
A two-week price spike cannot rewrite a monthly payroll survey, and June and July 2026 are still preliminary. Even giving the Iran war the first half of the year, the constructed oilfield total rose by only about 5,000 jobs from January to June. That is not a boom. It is a rounding error on a payroll that never came back.
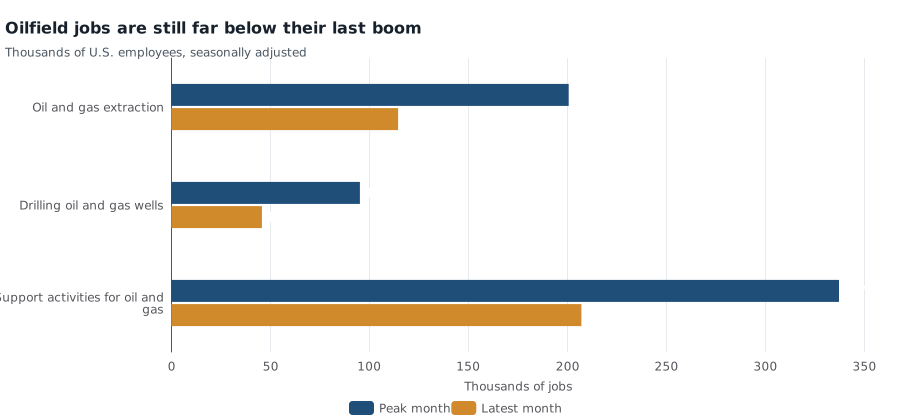
Peak month versus latest month of seasonally adjusted U.S. payroll employment, thousands of jobs. Extraction: 200.8 in October 2014 versus 114.6 in July 2026. Drilling: 95.3 in May 2012 versus 45.8 in June 2026. Support activities: 337.4 in September 2014 versus 207.2 in June 2026. Latest months are preliminary. Source: U.S. Bureau of Labor Statistics, Current Employment Statistics.
| Industry (CES, seasonally adjusted) | Peak month | Peak (thousands) | Latest month | Latest (thousands) | Percent below peak |
|---|---|---|---|---|---|
| Oil and gas extraction | 2014-10 | 200.8 | 2026-07 | 114.6 | 42.9 |
| Drilling oil and gas wells | 2012-05 | 95.3 | 2026-06 | 45.8 | 51.9 |
| Support activities for oil and gas operations | 2014-09 | 337.4 | 2026-06 | 207.2 | 38.6 |
| Sum of the three (constructed) | 2014-09 | 622.8 | 2026-06 | 368.1 | 40.9 |
Texas, which still holds a little more than half of the country's oil-and-gas-extraction jobs, has not rewritten the national picture. On a not-seasonally-adjusted basis, so that the same calendar month can be compared, Texas extraction employment was 62,800 in July 2026 against 106,800 in July 2014 — 41 percent lower, 44,000 jobs thinner. Those Texas jobs were 54 percent of U.S. not-seasonally-adjusted extraction employment in July 2026, almost the same share as in July 2014. The shrinkage is national, not a shift out of Texas.
Downstream of the wellhead, petroleum refineries employed 61,300 in June 2026, fewer than the 78,600 on payroll in January 2000. Extraction itself is a sliver of the labor market: 0.07 percent of U.S. nonfarm payrolls in July. A Hormuz spike can still move gasoline prices and, with a lag, consumer inflation. It is not arriving as a 2014-style impulse to American hiring.
That distinction matters for the argument now being put to the Fed. Higher policy rates do not reopen the Strait of Hormuz, as the same market commentary noted. They also do not need to cool an oilfield hiring surge that is not in the payroll data. Analysts arguing that China absorbed the shock by drawing down unobserved crude stocks are making a claim about barrels, not about U.S. jobs; this research does not test that import figure. It does show that U.S. producers have not answered the price spike with a wave of new payrolls.
Payrolls are not production. After the 2015–16 and 2020 busts, remaining crews and wells became more productive; a smaller headcount can still move more oil. The CES numbers cannot say how many barrels the United States is pumping. They can say that whatever is happening to supply, it is not rebuilding the oilfield workforce that defined the last boom. Energy stocks can rally on the same barrel that does not hire.
Sources and methods
Figures are from the Bureau of Labor Statistics Current Employment Statistics national estimates and State and Area Employment for Texas, using the CES snapshot released in the August 24, 2026 data files. Oil and gas extraction is CES series CES1021100001; drilling oil and gas wells is CES1021311101; support activities for oil and gas operations is CES1021311201. Values are thousands of employees; headcounts in the text multiply those published thousands by 1,000. June and July 2026 national observations, and July 2026 Texas observations, carry BLS preliminary footnotes.
The combined “oilfield” total is a constructed sum of those three mutually exclusive NAICS industries. It is not an official BLS aggregate and excludes refining, oilfield-machinery manufacturing, and gasoline-station retail. Texas comparisons use not-seasonally-adjusted extraction employment so that July 2014 can be set against July 2026; they should not be mixed with the seasonally adjusted national series.
This article was researched on 10 September 2026, after the digest date of 29 July 2026, and is retrospective: it uses the later CES snapshot rather than only data knowable that July day. The underlying edition was reconstructed from RSS publication dates, not from an original arrival-day capture. Interactive chart layout was not separately tested in a browser.
Research Date
The displayed date matches the related news edition. Research was completed 2026-09-10.
Related news: Daily · 2026-07-29
More Research
Pakistan’s Prices More Than Doubled. Then Inflation Came Back.
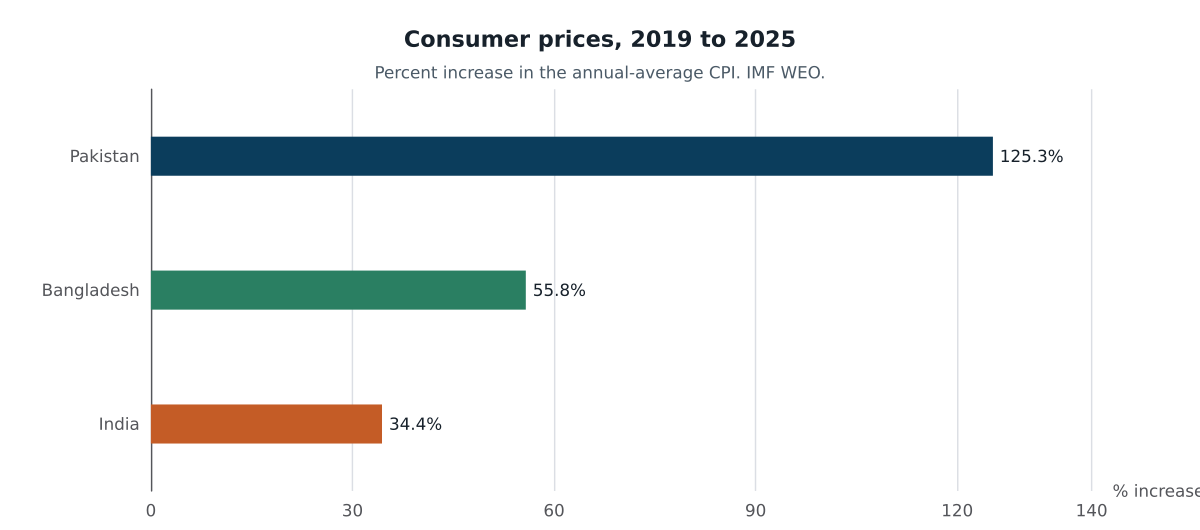
IMF accounts show Pakistan’s consumer prices rose 125 percent from 2019 to 2025. Inflation cooled in 2025 without reversing that level, then turned back up.
Nuclear Power Barely Grew For 25 Years. It Still Outproduces Solar.
World on-grid solar capacity overtook nuclear in 2018 and is now nearly six times larger, but nuclear still generated more electricity than solar in 2023. Almost all net nuclear growth since
Three Million Unemployed Is Not Germany’s Old Jobs Crisis
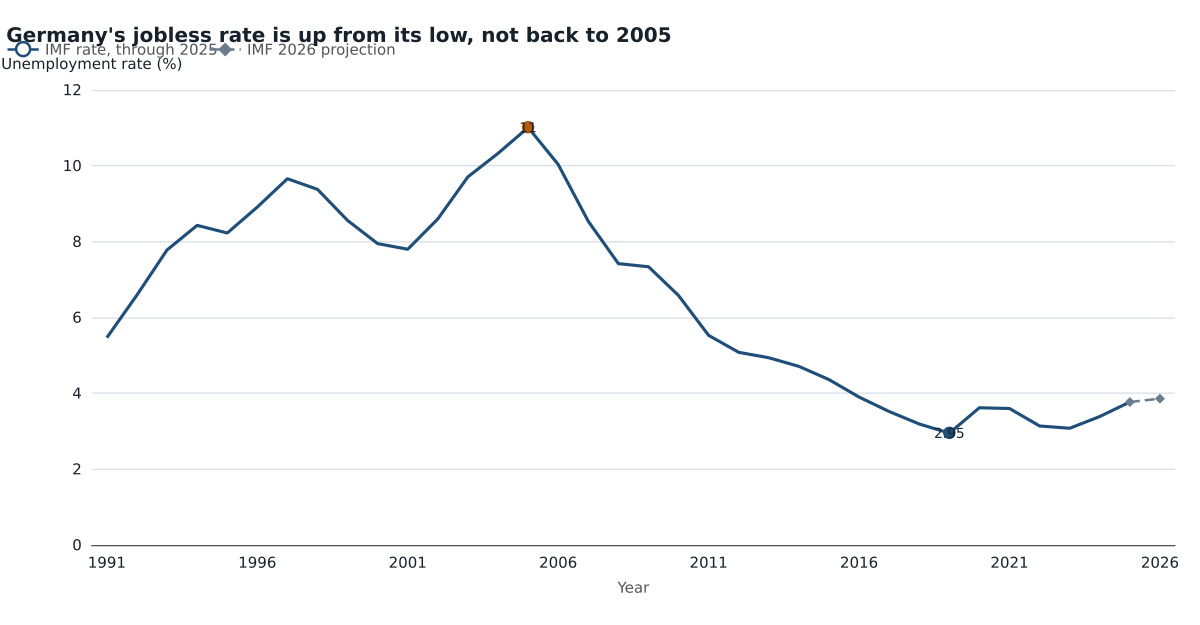
Germany’s IMF unemployment rate rose to 3.8 percent in 2025 from a 2.95 percent low in 2019, still far below the 11 percent peak of 2005, while employment stayed near 42.5 million.