LunarWeave
Nuclear Power Barely Grew For 25 Years. It Still Outproduces Solar.
A policy argument is being staged as if it were a technology argument. In late July 2026, the World Nuclear Association reported that the World Bank was shifting to fund nuclear projects, and other outlets described a U.S. civil-nuclear deal with Saudi Arabia. In the same news cycle, unused solar panels were said to be piling up on resale markets, while Beijing published a position paper rejecting Western “overcapacity” charges as a misreading of Chinese production.
Those headlines pull in opposite directions: revive a technology that looked politically frozen, or treat solar as already so abundant that brand-new modules never reach a roof. IRENA electricity statistics settle a narrower, more useful question. Did the nuclear fleet actually stall while solar’s nameplate capacity exploded — and has that explosion shown up in electricity generated, not just in megawatts installed?
A fleet that barely moved
From 2000 to 2025, world on-grid nuclear capacity rose from 358.5 gigawatts to 406.9 GW, a 13.5 percent increase. On-grid solar capacity rose from 1.2 GW to 2,381.2 GW over the same years — about two thousand-fold.
Solar’s nameplate fleet first exceeded nuclear’s in 2018 (484.3 GW against 405.2 GW). By 2025 it was 5.9 times larger. Nuclear’s line on the chart is almost flat. Solar’s is a hockey stick.
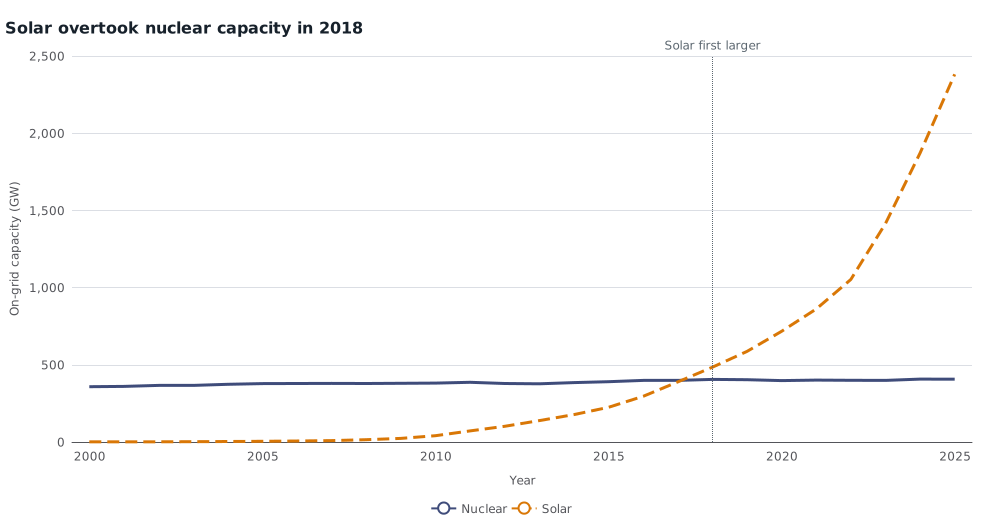
World on-grid electricity capacity, gigawatts, 2000–2025. Solar energy (dashed) first exceeded nuclear (solid) in 2018. IRENA region extracts. Capacity is nameplate, not electricity generated. The 2025 figures may be preliminary.
Wind followed a similar path on the capacity ledger: it overtook nuclear in 2015 and reached 1,290.6 GW by 2025. The megawatt race among non-fossil sources was not close. Nuclear lost it years ago.
Megawatts are not megawatt-hours
Electricity is what grids deliver. IRENA’s generation series run only through 2023, so they cannot yet show whether 2024–2025’s extra solar panels closed the gap. In 2023, the last overlapping year, the comparison is unambiguous.
Nuclear plants generated 2,738.5 terawatt-hours. Solar generated 1,623.8 TWh — 59.3 percent as much — even though solar capacity that year was already 3.55 times nuclear’s (1,415.5 GW against 399.1 GW). Nuclear still produced 1.69 times as much electricity from 28.2 percent as much on-grid capacity.
| 2023, world | On-grid capacity (GW) | Generation (TWh) | Implied capacity factor |
|---|---|---|---|
| Nuclear | 399.1 | 2,738.5 | 78.3% |
| Solar | 1,415.5 | 1,623.8 | 13.1% |
The implied calendar-year capacity factors — generation divided by nameplate capacity times 8,760 hours — are 78.3 percent for nuclear and 13.1 percent for solar. That is an accounting ratio, not a verdict on any particular plant. It is why a solar glut in panels can coexist with nuclear still leading solar in kilowatt-hours.
Wind is the closer rival on the generation chart. In 2023 it produced 2,303.9 TWh, 84.1 percent as much as nuclear. Solar and wind together generated 3,927.7 TWh, 1.43 times nuclear. The combined variable-renewable fleet has already passed nuclear in output. Solar alone has not.
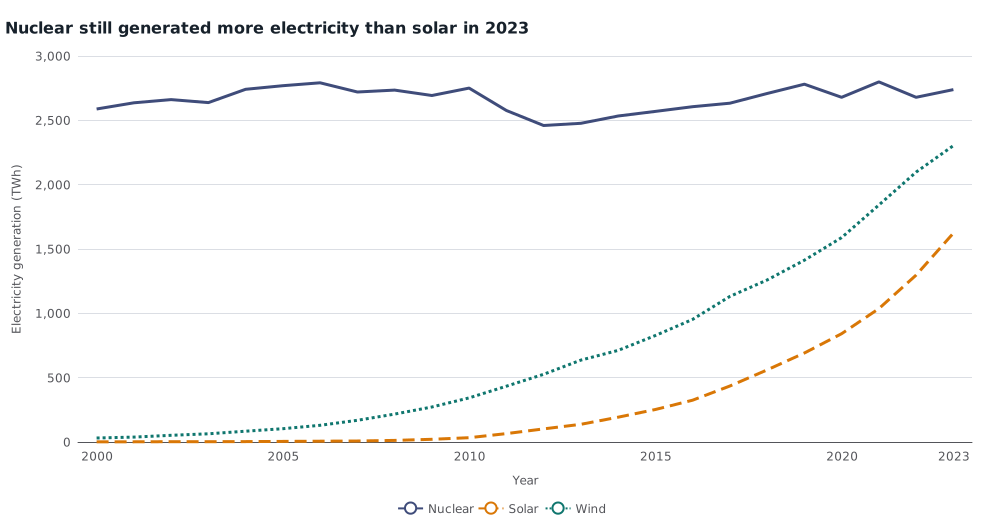
World electricity generation, terawatt-hours, 2000–2023. Nuclear (solid) still led solar (dashed) in 2023; wind (dotted) had nearly caught nuclear. IRENA region extracts. No generation observations for 2024–2025 are in this snapshot.
None of this displaces fossil fuels. Fossil plants generated 17,875.1 TWh in 2023 — 6.5 times nuclear, and still several times solar and wind combined. On-grid fossil capacity in 2025 remained 4,622.7 GW. The nuclear-versus-solar argument is a fight over a minority of world electricity.
The stall is not global. It is everywhere except China.
World nuclear capacity did not stall because every country stood still. It stalled because growth in China offset shrinkage elsewhere.
China’s on-grid nuclear fleet rose from 2.3 GW in 2000 to 62.5 GW in 2025, a 60.2 GW increase. The world’s net increase was only 48.4 GW. Nuclear capacity outside China — IRENA’s world region total minus the China country total — fell from 356.2 GW to 344.4 GW.
Europe’s regional nuclear fleet dropped from 151.9 GW to 120.4 GW, a 20.8 percent decline. The United States went from 97.9 GW to 96.9 GW. France, still the largest Western operator in these extracts, slipped from 63.2 GW to 61.4 GW. Japan’s nameplate capacity fell from 45.2 GW to 33.1 GW; that figure counts installed capacity, not how many reactors actually ran after Fukushima. Germany’s series ends in 2022 at 4.2 GW, down from 22.4 GW in 2000; later years are missing, not recorded as zero.
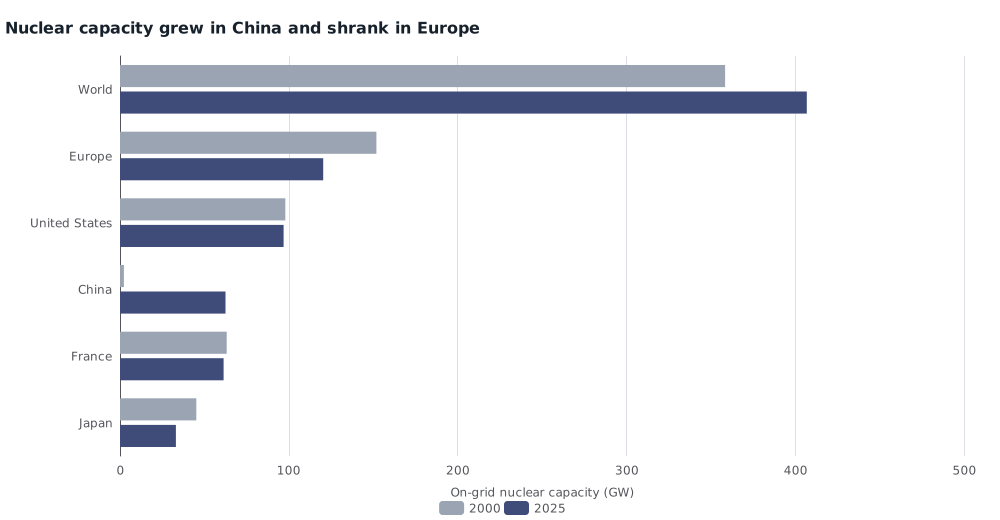
On-grid nuclear capacity, gigawatts, 2000 versus 2025. World and Europe are IRENA region totals; the United States, China, France and Japan are country totals.
If development banks and governments are reopening nuclear finance, they are not plugging a hole in China’s buildout. They are responding to a fleet that stopped growing in the places that once ran it.
Saudi Arabia illustrates the other starting point. IRENA’s country nuclear-capacity series has no observations for Saudi Arabia from 2000 through 2025, while the same geography has a complete solar series that reaches 11.9 GW in 2025. An empty extract is not a recorded zero, but it is consistent with a nuclear programme that has not yet shown up as operating capacity.
China’s solar boom is installation, not just exports
The unused-panel stories and Beijing’s overcapacity rebuttal are about manufacturing and trade. Installed capacity is a different object: modules that were connected to a grid.
China had 1,201.7 GW of on-grid solar in 2025, 50.5 percent of the world total. It accounted for 315.1 GW of the world’s 509.6 GW increase from 2024 to 2025 — 61.8 percent of new capacity in that year. The rest of the world still added solar; it did not add it at China’s pace.
That does not prove or disprove a glut of unsold panels. It does show that a large share of the solar megawatts now on IRENA’s books were installed inside China, not left on a dock. A manufacturing surplus can still exist on top of that domestic boom. The capacity data cannot see warehouse inventory.
What the nuclear turn is actually answering
Solar’s glut, if the resale-market reporting is right, is a megawatt story. Nuclear’s stall is an electricity story, and it is geographically specific.
The world’s nuclear plants generate more power than solar from a fleet that has barely grown in a quarter-century, because they run so much more of the time. Wind has nearly matched that output without nuclear’s political baggage. Fossil fuels still supply most electricity. A World Bank that funds reactors would be placing a long-lead bet on firm, high-capacity-factor supply in countries where the nuclear fleet has been shrinking — not correcting a failure of solar to scale on paper.
Those are not reasons to prefer one technology. They are the quantities that make the preference intelligible.
Sources and methods
This is retrospective research completed on 10 September 2026, using later IRENA releases than would have been available on the 28 July 2026 news date. That day’s edition was reconstructed from RSS publication dates, not an original arrival-day capture.
All capacity and generation figures are from the IRENASTAT extracts in the pinned snapshot 20260824T135703Z-d846f650 (created 24 August 2026). World and Europe figures are region tables; China, the United States, France, Germany, Japan and Saudi Arabia are country tables of the same technology and grid connection. Rest-of-world nuclear is the world region total minus China and therefore mixes those two official aggregates. On-grid solar energy includes photovoltaic and solar-thermal electricity capacity. Generation is not converted from capacity; the two measures are separate IRENA series. Implied capacity factors use 8,760 hours because 2023 is not a leap year. Missing observations, including Saudi nuclear capacity and German nuclear capacity after 2022, are not treated as zero. IRENA’s 2025 capacity values may be preliminary. Browser and mobile layout of the charts were not separately tested beyond SVG rendering.
Reported news claims about World Bank policy, a Saudi nuclear deal, unused solar panels and oil-major profits are attributed to the original outlets and were not independently verified.
Research Date
The displayed date matches the related news edition. Research was completed 2026-09-10.
Related news: Daily · 2026-07-28
More Research
The Oil Shock Is Not A U.S. Oil-Jobs Boom
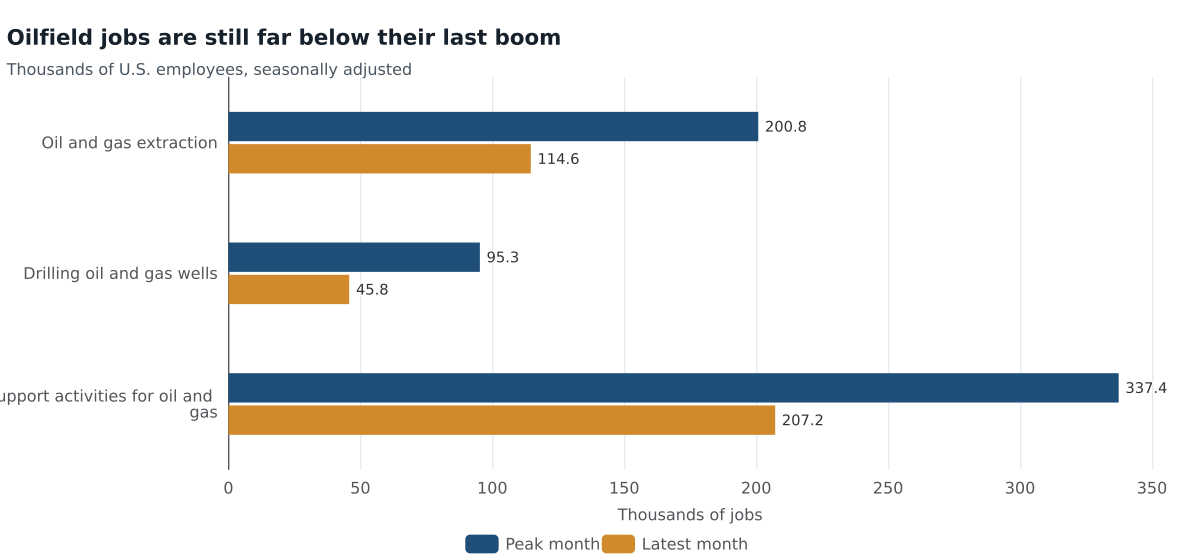
U.S. oilfield payrolls remain about 40 percent below their 2014 peak; the 2026 price spike is not a hiring boom.
Missile Plants Hired. The Shipyards Barely Moved.
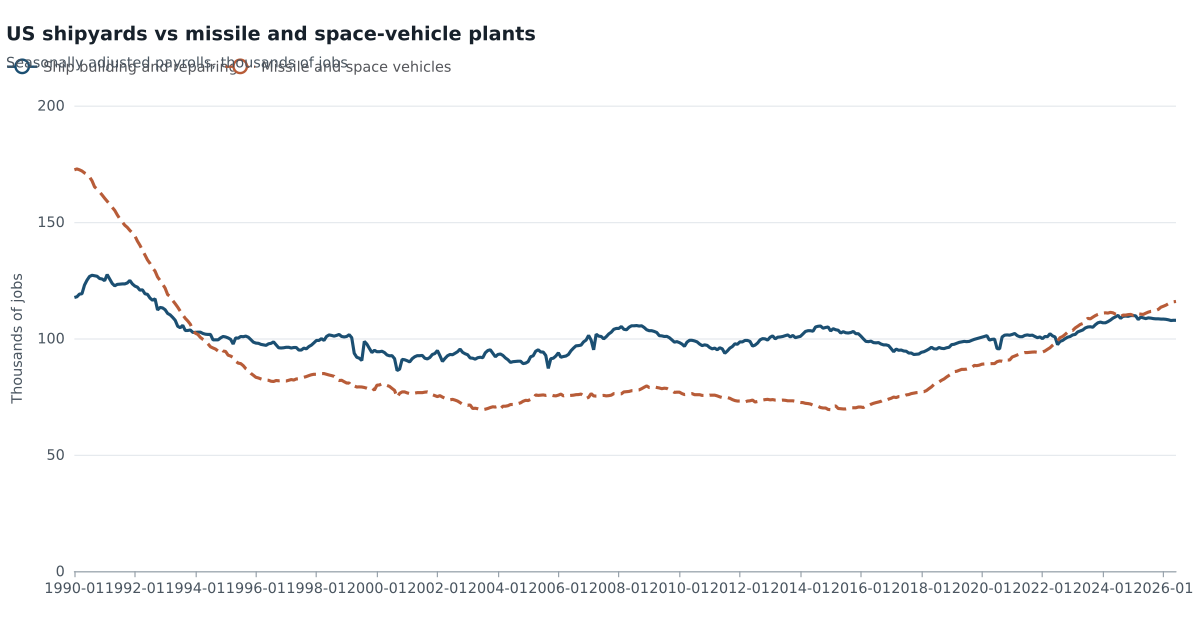
US shipyard payrolls have barely grown since 2015, even as missile-and-space plants hired. A look at BLS factory jobs behind the defense-stock boom.
Pakistan’s Prices More Than Doubled. Then Inflation Came Back.
IMF accounts show Pakistan’s consumer prices rose 125 percent from 2019 to 2025. Inflation cooled in 2025 without reversing that level, then turned back up.