LunarWeave
Norway’s Data-Center Plans Are Larger Than Its Wind Boom
Norway has spent a decade selling cheap, low-carbon electricity to anyone who will put servers in a fjord. The pitch is simple: a hydro-heavy grid, cool air, and spare power that used to flow to Europe. Rzeczpospolita, citing Norway’s energy regulator NVE, reports that data centers in the country now use about 3 billion kilowatt-hours a year — 3 terawatt-hours — and that this could rise to 25 TWh by 2035. The same report says the extra load would turn Norway from an electricity exporter into an importer, with prices rising sharply.
Those last two claims are NVE’s, as reported. They cannot be checked in generation statistics, which do not record trade or prices. What the generation books can answer is whether 25 TWh is a rounding error on a hydro surplus or a system-scale claim. It is the latter. Twenty-five terawatt-hours is 15.8 percent of the electricity Norway produced in 2024. It is more than Iceland’s entire power system. And the extra 22 TWh of demand is in the same league as two decades of growth in Norwegian output — on a grid that is still 87 percent hydropower, and whose only new bulk source, onshore wind, has barely added a turbine since 2021.
Sixteen percent of last year’s generation
IRENASTAT, the International Renewable Energy Agency’s electricity accounts, put Norway’s 2024 gross generation at 158.6 TWh. That figure is preliminary, and it is generation, not consumption: it includes electricity that plants use themselves. Even so, the arithmetic is blunt. Reported data-center demand of 3 TWh is 1.9 percent of that 2024 total. Twenty-five TWh would be 15.8 percent. The 22 TWh increment in between is 13.9 percent of last year’s output.
A 24-hour load of 25 TWh is about 2.9 gigawatts if it ran flat through an 8,760-hour year. Norway’s whole generating fleet was 41.3 GW at the end of 2025. Nameplate capacity is not spare energy: most of that fleet is hydro, which already runs to fill existing demand and export contracts, and whose output swings with rainfall.
The country still runs on rain
Hydropower supplied 137.4 TWh in 2024, or 86.7 percent of generation. Onshore wind supplied 14.5 TWh (9.2 percent). Solar photovoltaic plants supplied 0.55 TWh (0.3 percent). All non-renewable sources together supplied 3.3 TWh (2.1 percent), of which natural gas was 1.5 TWh. IRENA’s total renewable series leaves a 2.7 TWh remainder after hydro, wind and solar — other renewables, not a hidden thermal fleet.
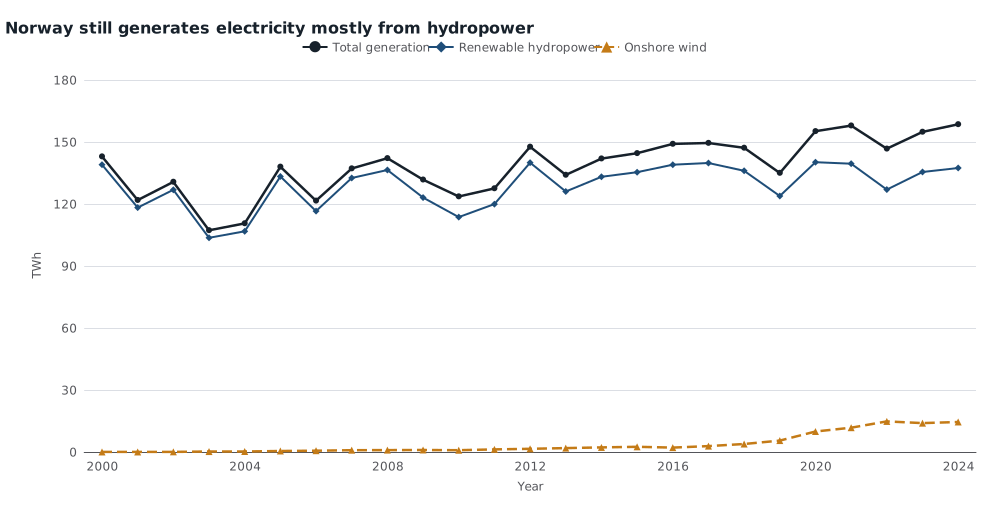
Annual gross electricity generation in Norway, terawatt-hours, 2000–2024. Total generation is IRENASTAT total renewable plus total non-renewable. Wind is onshore only. 2024 generation is preliminary. Source: IRENASTAT.
The line that matters is the hydro line. It is the system. Total generation and hydropower move together, including through the 2003 drought, when output fell to 107.3 TWh. Wind is the only series that has changed the shape of the chart, and only after 2018.
25 TWh is not a rounding error
Single-year comparisons with 2000 are a trap: that was a wet year (143.0 TWh), so the 15.6 TWh rise to 2024 understates how much extra power Norway has actually found since the drought years. Five-year averages are kinder to the supply side. Mean generation in 2020–24 was 154.7 TWh, against 122.7 TWh in 2000–04 — a 32.0 TWh increase over two decades. Hydropower averages rose 17.0 TWh; onshore wind rose 12.9 TWh.
The reported 22 TWh data-center increment is 69 percent of that entire two-decade lift, and NVE’s horizon is 2035, not 2045. Put another way, 25 TWh of server load would be larger than Iceland’s 19.6 TWh of generation in 2024, and 1.7 times Norway’s own wind output.
| Measure | TWh |
|---|---|
| Reported data-center demand, 2035 | 25.0 |
| Norway hydropower range, 2003–2020 (max − min) | 36.6 |
| Norway generation, 2020–24 average minus 2000–04 average | 32.0 |
| Iceland total generation, 2024 | 19.6 |
| Norway onshore wind, 2024 | 14.5 |
| Reported data-center demand, now | 3.0 |
| Norway total generation, 2024 | 158.6 |
NVE demand figures as reported by Rzeczpospolita. All other rows are IRENASTAT gross generation. 2024 generation is preliminary.
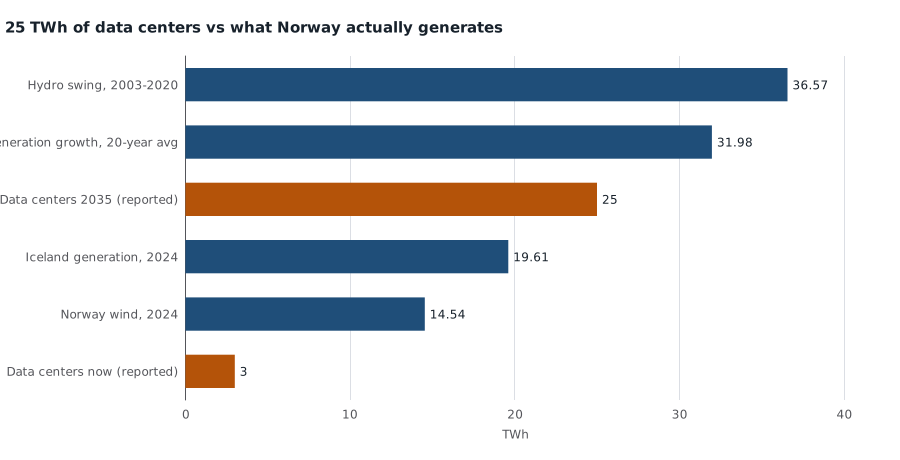
Terawatt-hours. Orange bars are reported NVE data-center demand; blue bars are IRENASTAT generation. Demand is not gross generation, and IRENA does not measure electricity trade. Sources: NVE via Rzeczpospolita; IRENASTAT.
Sweden generated 172.4 TWh in 2024 and Finland 83.2 TWh. Norway is not a small grid. It is a large hydro grid being asked to absorb a new industrial load the size of a small country’s entire power system.
The wind boom has already stopped
Capacity, unlike a wet year, does not vanish in a drought. Norway’s hydropower fleet grew from 26.8 GW at the end of 2000 to 33.2 GW at the end of 2025 — 6.4 GW in a quarter-century. Onshore wind did the sudden work: 1.2 GW at end-2017, 5.05 GW at end-2021. Then it stopped. End-2022 capacity was 5.06 GW; end-2025 was still 5.06 GW, a rise of 3.7 megawatts in three years. Solar reached 0.90 GW by end-2025. Non-renewable capacity has been shrinking, from 1.45 GW at end-2010 to 0.48 GW at end-2025.
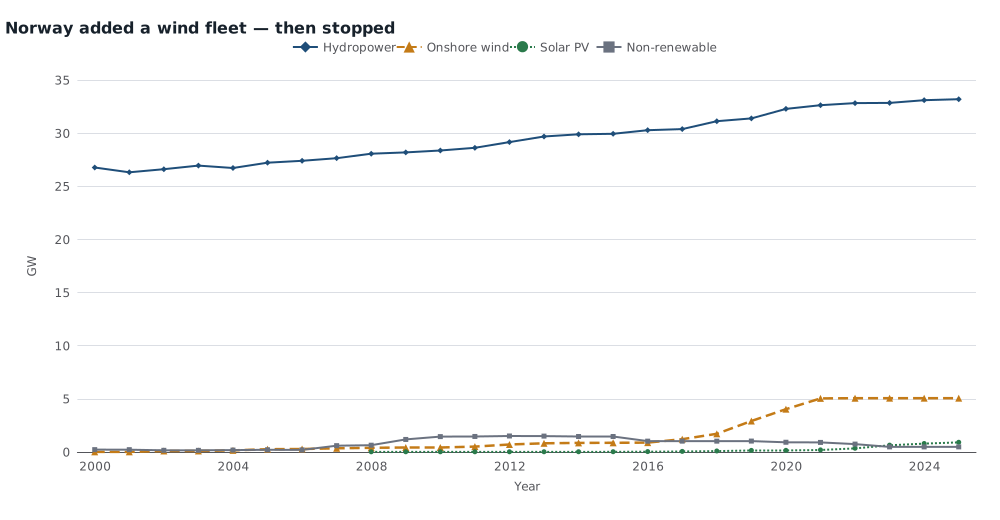
End-of-year net generating capacity, gigawatts, 2000–2025. Solar-PV observations begin in 2008; earlier years are missing, not zero. Source: IRENASTAT.
If the extra 22 TWh had to come from new wind running at Norway’s 2024 onshore-wind capacity factor (33 percent), it would take about 7.7 GW of additional wind — more than the entire existing fleet. The same 22 TWh at 2024’s hydro capacity factor (47 percent) would take about 5.3 GW of additional hydro. Those are illustrations, not a build plan. Data centers want power every hour; annual capacity factors are not firm megawatts. They do show that 22 TWh is not a leftover from plants Norway has already built.
Dry years already move more electricity than the servers would
Between 2000 and 2024, Norwegian hydropower ranged from 103.6 TWh in 2003 to 140.2 TWh in 2020 — a 36.6 TWh swing, larger than the entire 25 TWh data-center projection. Natural gas, the obvious thermal backstop, peaked at 4.8 TWh in 2010, a weak hydro year. That is 19 percent of 25 TWh, not a substitute for it. IRENA publishes no nuclear-generation observations for Norway.
NVE’s reported conclusion that Norway would become an importer is a statement about the balance of generation, consumption and trade. IRENA does not publish that balance here. What it does show is that the export cushion, if it exists, sits on a weather-driven hydro system whose year-to-year range already exceeds the load being discussed, and whose only recent diversification has stalled. A 25 TWh data-center fleet would not be a boutique customer on a surplus grid. It would be a second industrial climate, bolted onto the first.
Sources and methods
This is retrospective research completed on 31 October 2026, using the IRENASTAT snapshot pinned for this work (normalized run of 8 October 2026). The news that motivated the question is from 30 October 2026. Later IRENA releases were not used; 2024 generation is flagged by IRENA as preliminary and “not accurate at aggregate levels.”
Electricity generation is gross production in gigawatt-hours, converted to terawatt-hours by dividing by 1,000. Capacity is end-of-year net generating capacity. Total generation is the sum of IRENA’s total renewable and total non-renewable series; those two series are treated as a partition. Onshore wind is used because the country file carries that series; the regional “wind energy” aggregate is not mixed in. Missing solar years before 2008, an empty nuclear-generation extract, and an empty natural-gas capacity extract are omitted, not filled with zeros. Reported 3 TWh and 25 TWh data-center figures come from a news excerpt of NVE, not from IRENA, and are not independently verified against the regulator’s full report. Generation is not consumption, not exports, and not a price.
Research Date
The displayed date matches the related news edition. Research was completed 2026-10-31.
Related news: Daily · 2026-10-30
More Research
America's Expansion Was Spread Across States — And Concentrated In A Few Industries
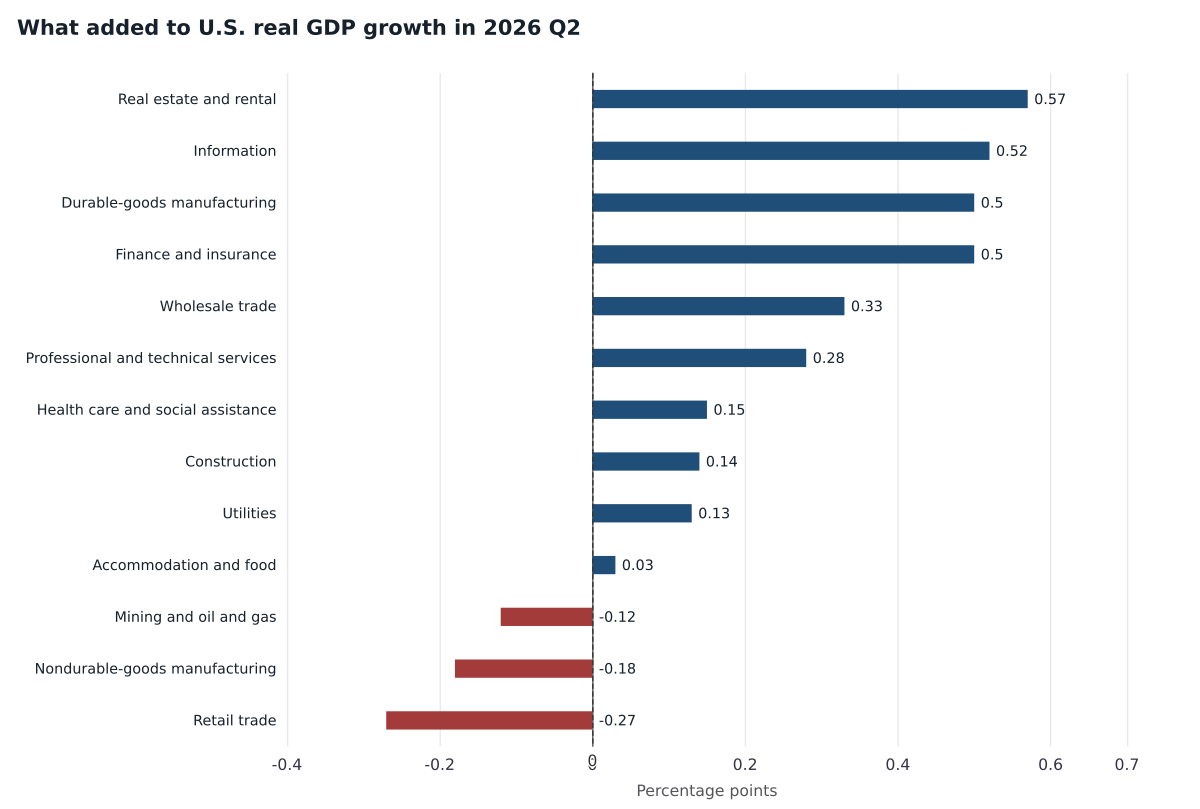
Through mid-2026 the U.S. expansion was geographically broad and industrially narrow: information and durable-goods factories did a large share of the growth; construction and mining did not
The U.S. Elderly Passed Young Children In 2023 — If “Children” Means Under 15
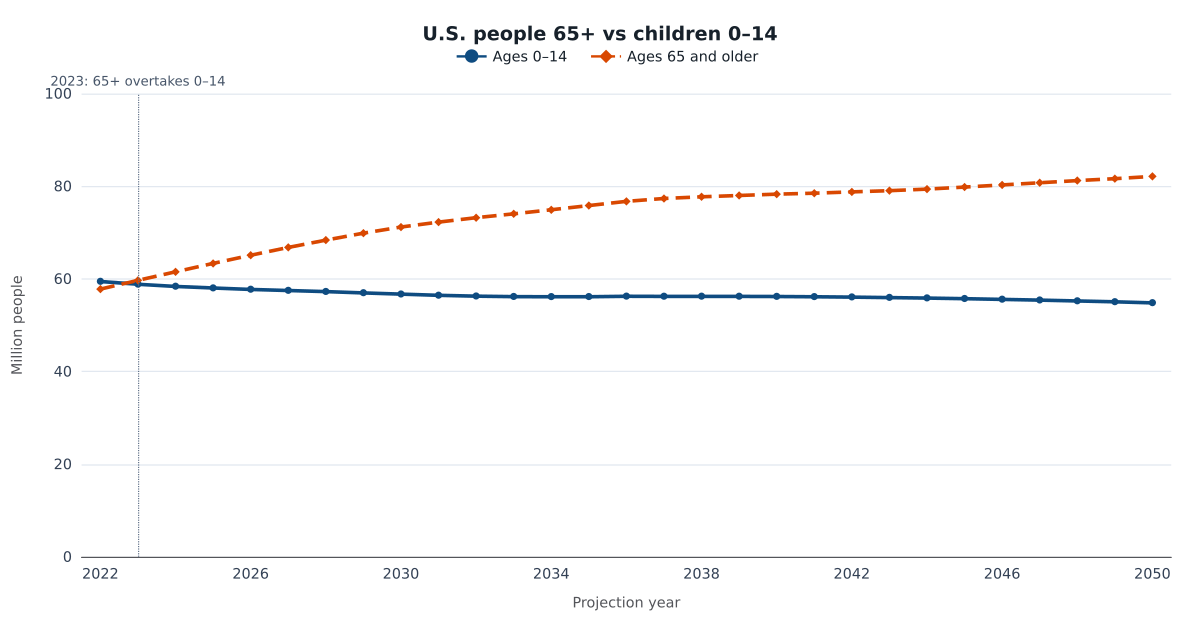
Census 2023 middle-series projections show U.S. people 65+ overtaking ages 0–14 in 2023 — the same comparison China was reported to have crossed in 2025 — while under-18s remain more numerou
The Information Boom Is In Output, Not In California Payrolls
US information-sector output was still rising several times faster than the whole economy in mid-2026, while California information payrolls were already 19 percent below their 2022 peak.