LunarWeave
The Last Time Japan’s Policy Rate Was 1.25%, Prices Were Falling
Jiji, citing informed sources, reported on 11 September 2026 that the Bank of Japan planned to lift its policy rate to 1.25% — the highest in about 31 years, and the same setting last seen in April 1995. The same week, the bank’s own producer-price index was running 7.6% higher than a year earlier, with metals and energy leading the jump.
A 1.25% policy rate can sound like a return to ordinary monetary life. The economy attached to that number is not 1995’s. In the IMF World Economic Outlook accounts, Japan’s consumer prices were falling in 1995. In 2025 they were rising at 3.2%. Real output, meanwhile, has barely expanded since 2019 — and it contracted in 2024.
This is a retrospective reading of those IMF annual series, using a data snapshot compiled in August 2026. It cannot see this week’s producer-price print, and it cannot confirm that the Bank of Japan will actually vote for 1.25%. What it can show is the starting position: an inflation break that is real, on an economy that is not booming.
1995 was cheap money on falling prices. This is not.
In 1995, Japan’s average consumer-price inflation was −0.1%. Real GDP grew 2.3%. Unemployment was 3.2%. The IMF’s estimated output gap was −1.7% of potential — spare capacity, not overheating.
In 2025, the same vintage has inflation at 3.2%, growth at 1.2%, unemployment at 2.5%, and an output gap of +0.4%. The labour market is tighter than in 1995. Prices are no longer falling. Growth is slower.
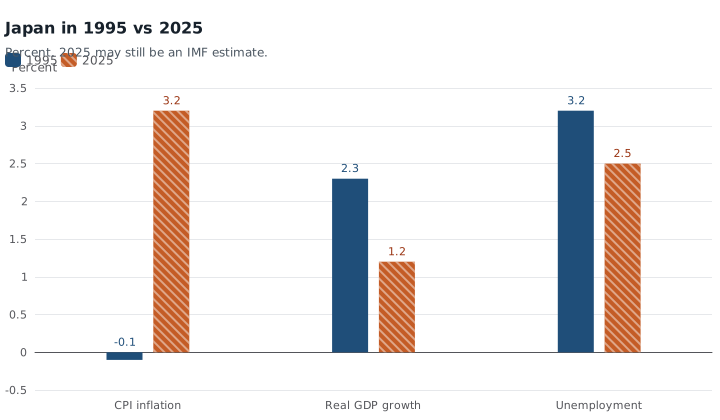
IMF World Economic Outlook annual figures for Japan. Inflation is average CPI, percent change; real GDP growth is constant-price GDP, percent change; unemployment is the IMF rate. 1995 is the last year Jiji says the policy rate stood at 1.25%. 2025 may still be an IMF estimate; unemployment is unchanged from 2024 in this vintage. Choose Japan in the linked MacroVedia charts. Rounded to one decimal place.
| 1995 | 2025 | |
|---|---|---|
| Average CPI inflation | −0.1% | 3.2% |
| Real GDP growth | 2.3% | 1.2% |
| Unemployment | 3.2% | 2.5% |
| Output gap (% of potential) | −1.7% | +0.4% |
The 2025 unemployment rate is identical to 2024 in this IMF file, so it should be read as a held estimate, not a freshly measured freeze. Even so, Japan is not hiking from the 5% jobless rates of the early 2000s. It is hiking from a tight labour market and a near-zero output gap — with inflation, not deflation, as the problem.
The deflation era did end. A boom did not begin.
That inflation number is not a one-month blip. Between 1992 and 2021, Japan’s average CPI inflation reached 2% in only one calendar year: 2014, when a consumption-tax increase did most of the work. In 15 of the years from 1995 through 2021, prices fell. Then the series broke: 2.5% in 2022, 3.3% in 2023 — the highest since 1991 — then 2.7% in 2024 and 3.2% in 2025. Four consecutive years above 2% is a regime change, not a tax-hike echo.
The GDP deflator, which tracks prices across the whole economy rather than a consumer basket, tells the same story. It fell 0.6% in 1995. It rose 4.6% in 2023, 3.2% in 2024 and 3.4% in 2025. Domestic prices, not only import stickers, have been moving.
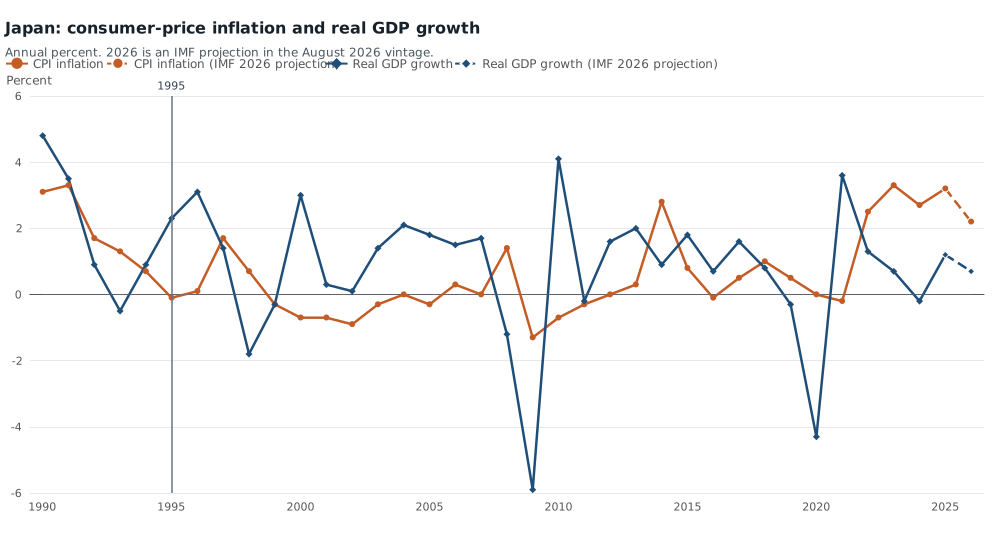
IMF World Economic Outlook, Japan, 1990–2026. Solid lines run through 2025; dashed segments are the IMF’s 2026 projection in the August 2026 snapshot. That projection does not include September 2026 producer-price or oil-price news. Rounded to one decimal place.
Output did not follow prices up. Real GDP contracted 0.2% in 2024. In constant prices, the 2024 economy was only 0.9% larger than in 2019; even the 2025 estimate is just 2.1% above that pre-pandemic year. Real GDP per person did better — 4.6% above 2019 by 2025 — because Japan’s population is falling, not because production took off.
Over 2022–2025, Japan’s inflation averaged 2.9% and its growth 0.8%. That is not the 2022 energy-shock profile of the United States, where the same four years averaged 4.4% inflation and 2.6% growth. It is closer to Germany’s stalled recovery: 4.9% average inflation and 0.2% average growth, including contractions in 2023 and 2024. Japan’s 2025 inflation print is actually hotter than Germany’s 2.3% or America’s 2.7%. The growth gap with America is the larger fact.
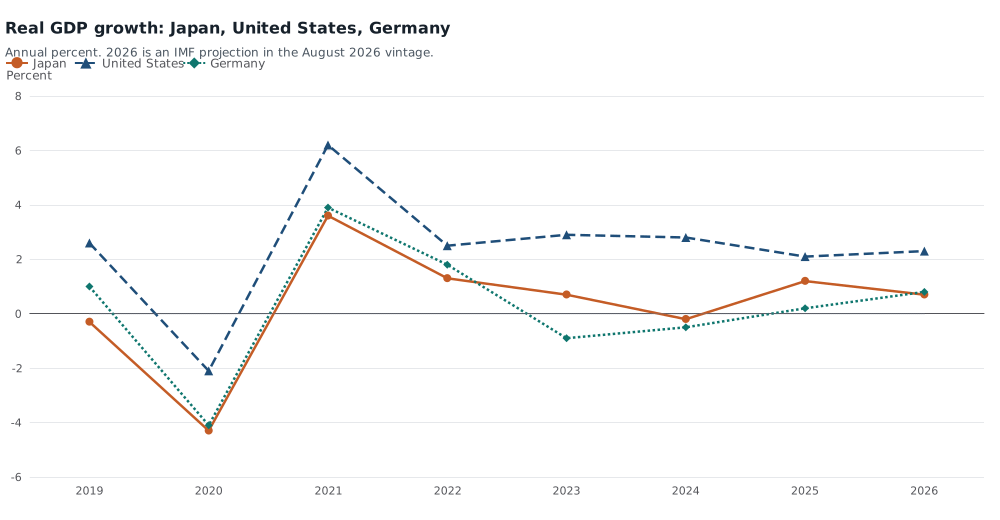
IMF World Economic Outlook, constant-price GDP, percent change. Japan is the solid series with circles; the United States is dashed triangles; Germany is dotted diamonds. 2026 is an IMF projection. Rounded to one decimal place.
A current-account surplus of 4.8% of GDP in 2025 means Japan, in these books, was not being forced into an external crisis by dearer imports. The surplus narrowed to 2.0% in the 2022 energy shock and to 0.7% in 2014; it did not disappear. That is a cushion, not a reason to treat 1.25% as boom-time policy.
What this week’s news adds — and what it cannot
The IMF’s 2026 projection in this snapshot is 2.2% inflation and 0.7% growth. Those figures were compiled before the 11 September producer-price release and before oil’s latest jump. They are a baseline, not a nowcast. If company-to-company prices are still rising more than 7% year-on-year because of metals, petroleum and coal products, the disinflation the Fund wrote down for 2026 is the part of the outlook most exposed to being wrong.
None of this says the Bank of Japan is mistaken to move. Four years of consumer inflation above 2%, a GDP deflator that has been rising at 3–5%, and unemployment near 2½% are the ingredients of a rate hike, not of another decade at the zero bound. The comparison with 1995 says something narrower and more useful: Japan is not restoring a 1995 policy rate to a 1995 economy. It is applying a 31-year-high rate to an economy that has already lived through an inflation break and almost no real expansion since 2019.
The live risk is therefore not that Japan is overheating in the old-fashioned sense. It is that imported costs are rising again on an economy whose real output has been, at best, crawling.
Sources and methods
Figures are annual IMF World Economic Outlook series from the pinned 24 August 2026 normalized snapshot (raw ingest 10 August 2026). Inflation is average consumer prices, percent change (PCPIPCH). Real GDP growth is constant-price GDP, percent change (NGDP_RPCH). Unemployment is the IMF labour-force rate (LUR). The output gap is the Fund’s estimate of actual minus potential output as a share of potential (NGAP_NPGDP). Current-account figures are percent of GDP (BCA_NGDPD). Real GDP and GDP per capita levels are constant-price national-currency series (NGDP_R, NGDPRPC); percentage changes from those levels are calculated from the stored values. GDP-deflator percentage changes are calculated from the IMF index (NGDP_D). Calendar year 2026 is treated as a projection; 2025 may still be an estimate. Observation dates are not release dates and cannot establish what was knowable on 11 September 2026. Averages for 2022–2025 are unweighted means of four annual observations. The 1.25% policy-rate plan and the April 1995 comparison are Jiji reports via Adnkronos, not IMF data. Producer prices are likewise reported Bank of Japan figures, not part of this extract. MacroVedia pages are multi-country views of the same IMF series; select Japan. Browser layout of the charts was not separately tested.
Research Date
The displayed date matches the related news edition. Research was completed 2026-09-12.
Related news: Daily · 2026-09-11
More Research
A $5,000 Check Is Modest For A Person And Huge For The Budget
Census adult counts put a $5,000-per-adult payment at $1.35 trillion — more than half the IMF’s already-large 2026 US general-government deficit.
Europe Cut Gas-Fired Power. It Did Not Get Off It.
After 2022, gas still generated 48% of Ireland's electricity and 45% of Italy's in 2023 — the last IRENA year before the September 2026 TTF spike.
Copper’s Record Was Already On The Books. Chile Still Runs A Deficit.
IMF annual copper was already at a record in 2025. Chile’s current account and budget were still in deficit.