LunarWeave
Intel’s Crash Landed On A California Industry. Oregon Already Lost The Jobs.
Intel’s shares fell 28.58% in a single session, a drop Dong-a Ilbo called the largest since 1974, after fourth-quarter sales guidance of $15–16 billion came in under the roughly $17 billion the market wanted. The same coverage put the one-day loss of market value at about $140 billion — even though third-quarter revenue had risen 21%. The memory boom lifting Samsung and SK Hynix, the reports said, was squeezing the PC market Intel still depends on.
Paper wealth can vanish anywhere a stock is listed. The harder question is whether that shock is a national factory event. It is not. U.S. computer and electronic product manufacturing — the Bureau of Economic Analysis industry that covers computers, communications equipment, semiconductors and related components — accounted for $315.4 billion of current-dollar GDP in 2025, about 1.0% of the U.S. economy and 10.8% of manufacturing. California produced 41.9% of that industry’s output. Real output for the country peaked in 2021 and has barely moved since 2022. In Oregon, where the same industry is a larger slice of the state economy than it is in California, semiconductor-component employment has already fallen back to around its 2009 level.
Those are industry accounts, not Intel’s payroll. They still show where a crash in U.S. chip-making sits.
A small industry on a narrow map
In 2025, current-dollar GDP in computer and electronic product manufacturing (NAICS 334) was $315.4 billion in the United States. That was 1.0% of national GDP and 10.8% of manufacturing GDP. It is a strategically noisy industry, not a large one.
It is also geographically tight. California’s $132.2 billion was 41.9% of the U.S. total. Texas was next, at 10.0%. Oregon, Massachusetts and New York filled out the top five. Together those five states produced 63.5% of U.S. electronics-factory GDP; the top ten produced 76.6%.
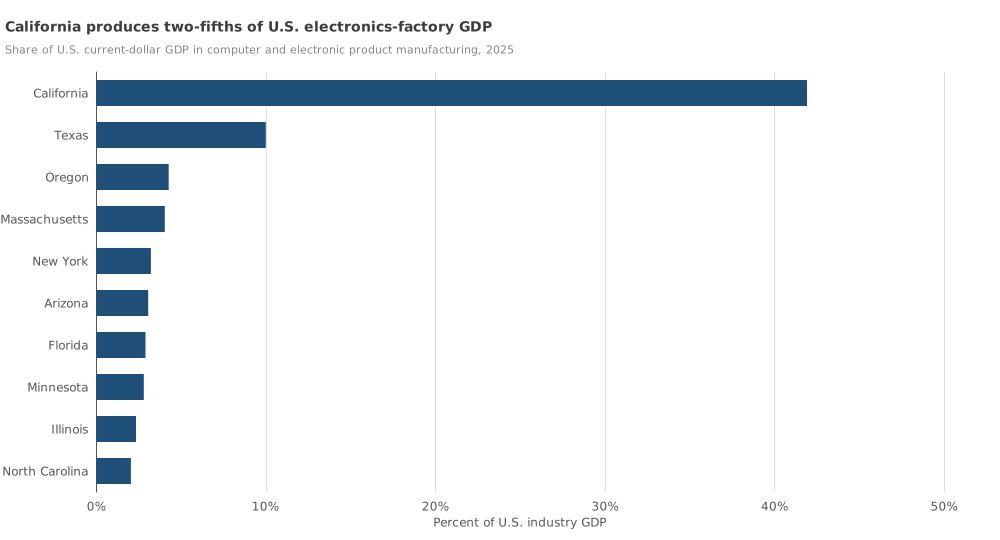
Percent of U.S. current-dollar GDP in computer and electronic product manufacturing (NAICS 334), 2025. California accounted for 41.9% of the $315.4 billion U.S. total; the top five states accounted for 63.5%. Shares use current dollars because chained-dollar industry GDP is not additive. Source: U.S. Bureau of Economic Analysis, GDP by state.
| Rank | State | 2025 GDP ($ billion) | Share of U.S. industry |
|---|---|---|---|
| 1 | California | 132.2 | 41.9% |
| 2 | Texas | 31.5 | 10.0% |
| 3 | Oregon | 13.5 | 4.3% |
| 4 | Massachusetts | 12.8 | 4.0% |
| 5 | New York | 10.2 | 3.2% |
| 6 | Arizona | 9.7 | 3.1% |
| 7 | Florida | 9.1 | 2.9% |
| 8 | Minnesota | 8.8 | 2.8% |
| 9 | Illinois | 7.4 | 2.3% |
| 10 | North Carolina | 6.4 | 2.0% |
California’s weight has grown. In 2010 it produced 26.4% of U.S. electronics-factory GDP. By 2025 that share was 41.9%. The industry did not spread with the AI boom. It bunched further in one state.
Oregon is the more exposed economy, even though it is much smaller. Computer and electronic product manufacturing was 3.9% of Oregon’s GDP in 2025 and 38.8% of Oregon manufacturing — against 3.1% of California’s GDP and 33.9% of California manufacturing. A hit to this industry is a California level story and an Oregon dependence story.
Real output stalled after 2021
Nominal dollars make the recent years look healthier than they were. U.S. current-dollar GDP in the industry rose 8.8% from 2022 to 2025. In chained 2017 dollars — BEA’s measure of real output — the same industry peaked at $300.7 billion in 2021, slipped through 2024, and recovered only to $294.0 billion in 2025. That 2025 reading is 18.2% above 2017, when current and chained dollars coincide, but 2.2% below the 2021 peak and just 0.4% above 2022.
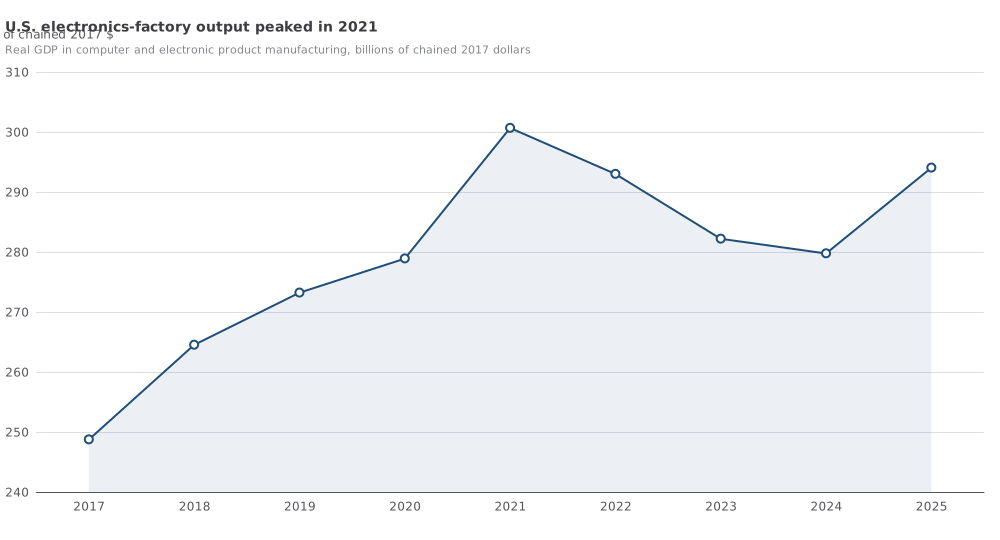
U.S. real GDP in computer and electronic product manufacturing, billions of chained 2017 dollars, 2017–2025. Real output peaked in 2021. Quality adjustment is large in this industry; the series measures real output, not jobs. Source: BEA GDP by state.
The pattern inside the big producing states is not a uniform boom. California’s real electronics-factory GDP rose 27.7% from 2017 to 2025, and Texas’s rose 31.0%. Oregon’s fell 11.8% over that span and 14.0% from 2022 to 2025. Arizona’s real output was 23.2% lower in 2025 than in 2022. Those are industry totals, not company results, and chained-dollar figures cannot be added across states. They are enough to say that the AI years did not lift electronics-factory output everywhere Intel has plants.
Oregon’s chip-component jobs went backwards
The jobs data that exist for this industry are state series from the Bureau of Labor Statistics, not a national chip-factory total. BLS publishes semiconductor and other electronic component manufacturing (NAICS 3344) employment for only some states. Missing states are unpublished, not zero, so the figures cannot be summed into a U.S. headcount. They can still be compared, state by state, in the same month. The series used here are not seasonally adjusted; the comparisons are August to August. August 2026 is preliminary.
Oregon is the sharpest published decline. Statewide NAICS 3344 employment peaked at 34,700 in August 2022. By August 2026 it was 25,400 — a drop of 9,300 jobs, or 27%. That is within 300 jobs of the 25,700 recorded in August 2009.
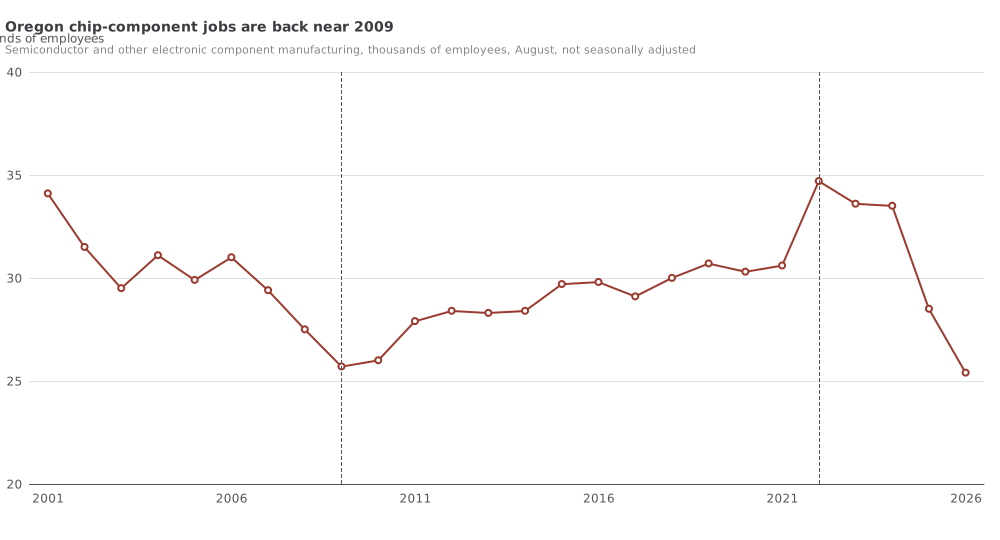
Oregon employment in semiconductor and other electronic component manufacturing (NAICS 3344), thousands of employees, August of each year, not seasonally adjusted. August 2026 is preliminary. The series is broader than Intel and is not a U.S. total. Source: BLS State and Area Employment.
Among the three large states that publish the same 3344 series, Oregon is the outlier. California’s semiconductor-component employment was 86,800 in August 2026, almost unchanged from 86,900 in August 2017 and 86,300 in August 2022. Texas rose from 39,800 to 50,700 over 2017–2026, a 27% increase. The AI-era hiring that does show up in these books is in Texas, not in Intel’s Oregon base.
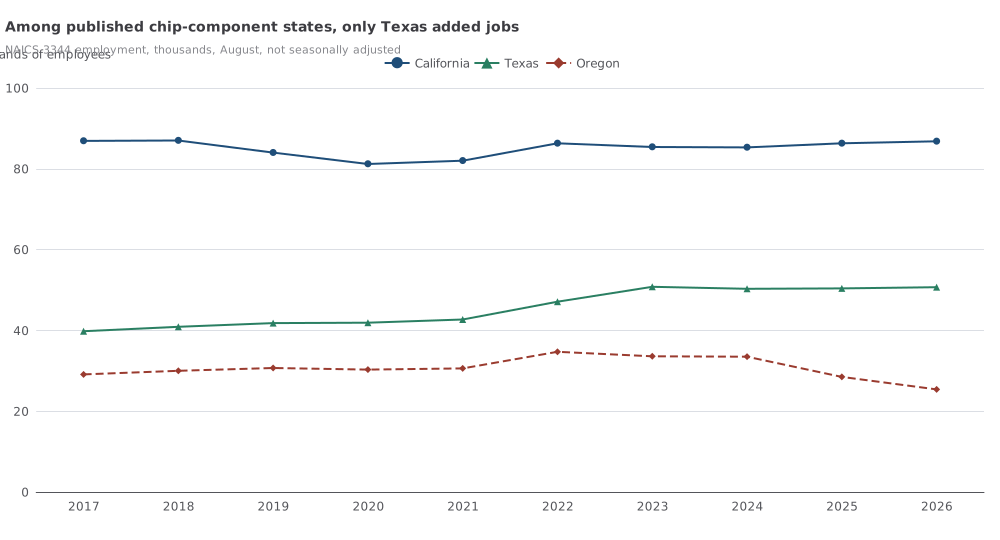
NAICS 3344 employment, thousands, August, not seasonally adjusted. Published states cannot be added into a U.S. total. August 2026 is preliminary. Source: BLS SAE.
A wider California series tells a different story from the narrow chip-component one. Computer and electronic product manufacturing (NAICS 334) employment in California fell from 256,400 in August 2022 to 227,500 in August 2026. Semiconductor device manufacturing in the state (NAICS 334413) was slightly higher: 48,500 versus 46,300. California still dominates the industry’s output. Its broader electronics factories have been shrinking even as the narrow semiconductor-device count ticked up.
Arizona’s published 334 employment — the series available there, covering the whole computer and electronics factory sector rather than semiconductors alone — was 32,800 in August 2026, the same as August 2017 and below 34,700 in August 2022. Whatever is being built in the desert had not, by last August, shown up as a larger factory workforce in that statewide series.
What the books do not say
None of this measures Intel’s own headcount, its market value, or whether fourth-quarter guidance was missed. Those are reported claims about one company. NAICS 334 is broader than semiconductors, and NAICS 3344 is broader than Intel. California’s 42% share includes computers, communications gear and other electronics, not a single firm’s fabs. Oregon’s job series includes every semiconductor-component plant the survey covers in the state.
The accounts still answer the question that a $140 billion one-day loss raises for the real economy. U.S. electronics-factory output is a 1% slice of GDP, two-fifths of it in California, and it has not been in a real production boom since 2021. The state most dependent on the industry has already given back its 2022 chip-component jobs. A crash in Intel’s equity is a price event in a concentrated industry that had, on the factory floor in Oregon, already turned down.
Methods and sources
This article is retrospective. The news dates to 1 November 2026; the calculations use pinned BEA and BLS snapshots available at research time (2 November 2026), including later releases than that news day. GDP figures are annual through 2025 from BEA’s 30 September 2026 state GDP release. Employment figures are monthly through August 2026 from BLS State and Area Employment (snapshot dated 24 August 2026 on the source event). August 2026 employment carries BLS’s preliminary footnote.
Current-dollar GDP is used for shares because BEA chained-dollar industry GDP is not additive across states or industries. Real GDP is used only for growth within a geography. BLS series are not seasonally adjusted; levels are compared in August. Unpublished state employment series are omitted, not treated as zero. Industry codes follow NAICS as BEA and BLS publish them; they are not a company identifier.
Primary sources: BEA GDP by state and regional methodology; BLS State and Area Employment. Intel’s one-day move is attributed to Dong-a Ilbo, not verified in these datasets.
Research Date
The displayed date matches the related news edition. Research was completed 2026-11-02.
Related news: Daily · 2026-11-01
More Research
America’s Household Electricity Bill Is Still 1.3 Percent Of Spending
BEA household electricity spending through 2025 is still 1.3 percent of US consumption, and the midterm data-center states do not share one bill.
Norway’s Data-Center Plans Are Larger Than Its Wind Boom
Norway’s reported 25 TWh data-center load is 16 percent of 2024 generation and larger than its wind fleet, on a hydro grid whose dry-year swings already exceed 25 TWh.
America's Expansion Was Spread Across States — And Concentrated In A Few Industries
Through mid-2026 the U.S. expansion was geographically broad and industrially narrow: information and durable-goods factories did a large share of the growth; construction and mining did not