LunarWeave
America’s Household Electricity Bill Is Still 1.3 Percent Of Spending
The 2026 midterms have turned the electric bill into a campaign issue. Dawn, citing Energy Information Administration prices, reported that home electricity rates had risen more than 10 percent since 2024, faster still in Ohio, Michigan and Pennsylvania, and that candidates were running against utilities and the data centers crowding onto the grid. Governors in Virginia and New Jersey had already tried freezing rates. Seats on public utility commissions were on the ballot in Arizona and Georgia.
That fight is about what households pay, and about what they expect to pay next. The Bureau of Economic Analysis keeps a different book: how much households actually spent on electricity, in current dollars, in every state, through 2025. Those accounts do not measure cents per kilowatt-hour, and they do not include 2026. They do answer a prior question the campaign has not settled. Has electricity become a larger slice of the American consumption basket? And is that slice fattest in the states named as data-center battlegrounds?
It has not, and it is not.
A small bill that has not grown as a share of spending
In 2025, US households spent $270 billion on electricity. That was 1.29 percent of personal consumption expenditures — $20.9 trillion in total. The share was 1.30 percent in 2019, 1.32 percent in the 2022 energy spike, and 1.64 percent in 1997, the first year of the state series. The low point in this history was 1.25 percent in 2021.
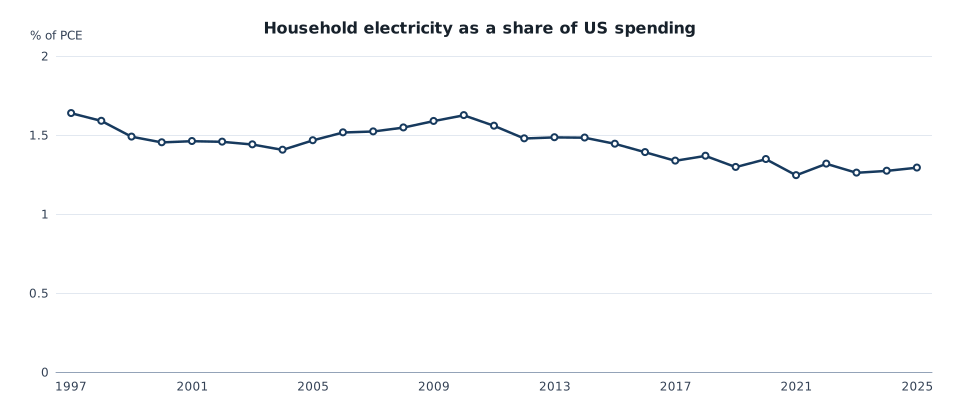
Household electricity spending as a percent of total personal consumption expenditures, United States, 1997–2025. Current dollars, not prices per kilowatt-hour. Source: U.S. Bureau of Economic Analysis, PCE by state, type-of-product table.
The recent acceleration is real and still small. Electricity spending rose 7.0 percent in 2025, against 5.3 percent for all consumption; over 2023–2025 it rose 14.0 percent, against 11.2 percent for the basket. That is why the share ticked up from 1.26 percent in 2023 to 1.29 percent in 2025. Stretch the comparison to 2019–2025, and electricity and total spending grew almost in lockstep: 44.1 percent against 44.6 percent. Derived per-person electricity spending was about $790 in 2025, up from $567 in 2019 — a 39 percent rise, matching the 40 percent rise in per-person consumption as a whole.
A 14 percent two-year jump in the bill can sting even when the item is 1.3 percent of spending. It is not evidence that electricity has taken over the household budget, or that the 2022 energy shock never receded in the annual accounts.
The campaign map is not the spending map
Dawn’s reporting grouped Ohio, Michigan and Pennsylvania as the battlegrounds where bills had grown fastest, and treated Virginia, Georgia and Arizona as data-center hubs. Household spending in 2023–2025 does not support treating those states as one story.
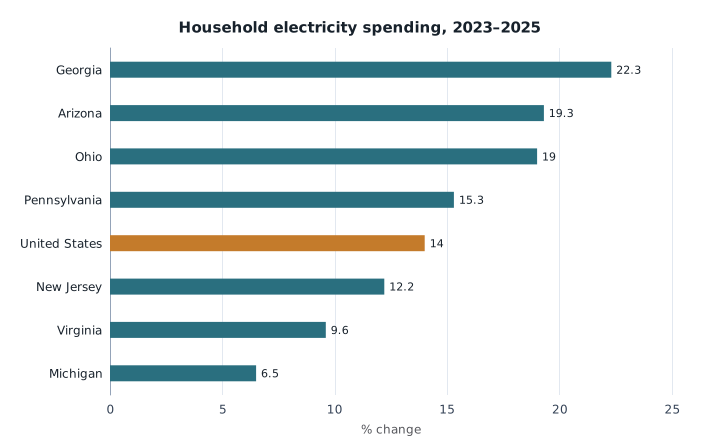
Percent change in household electricity personal consumption expenditures, current dollars, 2023 to 2025. Gold bar is the United States. This is spending, not EIA residential prices, and it ends in 2025. Source: U.S. Bureau of Economic Analysis.
Georgia’s household electricity spending rose 22.3 percent over those two years, fifth-fastest among the 50 states, and faster than the 12.1 percent rise in Georgia’s total consumption. Arizona rose 19.3 percent (tenth) and Ohio 19.0 percent (eleventh). Pennsylvania, at 15.3 percent, was only a step above the national 14.0 percent. New Jersey, whose governor froze rates after winning on the issue, rose 12.2 percent. Virginia — described in that reporting as home to the world’s largest concentration of data centers — rose 9.6 percent, slower than the US as a whole and slower than Virginia’s own 10.9 percent rise in total spending. Michigan rose 6.5 percent, 37th among the states.
The same split appears in how large the bill is, not just how fast it grew.
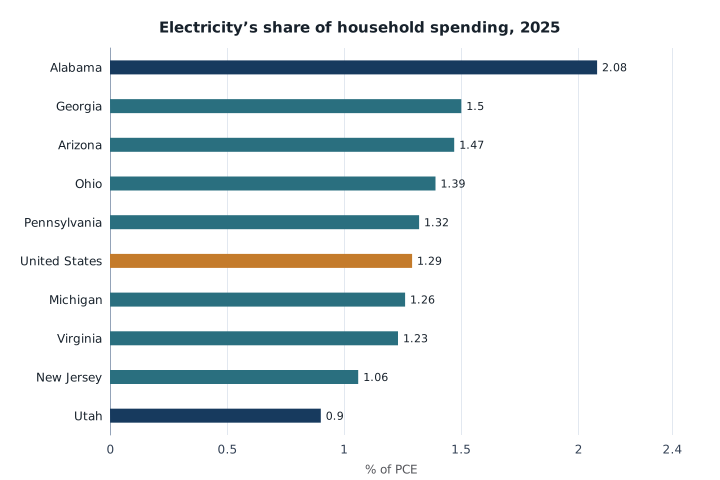
Household electricity as a percent of total personal consumption expenditures in 2025. Alabama and Utah are the highest and lowest among the 50 states. Gold bar is the United States. Source: U.S. Bureau of Economic Analysis.
| State | Electricity share of PCE, 2025 | Rank among 50 states | Spending change, 2023–2025 |
|---|---|---|---|
| Georgia | 1.50% | 10 | +22.3% |
| Arizona | 1.47% | 13 | +19.3% |
| Ohio | 1.39% | 17 | +19.0% |
| Pennsylvania | 1.32% | 23 | +15.3% |
| United States | 1.29% | — | +14.0% |
| Michigan | 1.26% | 30 | +6.5% |
| Virginia | 1.23% | 31 | +9.6% |
| New Jersey | 1.06% | 44 | +12.2% |
Alabama, not a data-center talking point in that coverage, had the heaviest electricity share in 2025, at 2.08 percent. Utah had the lightest, at 0.90 percent. Virginia’s share was below the national average, and it has fallen since 2019, from 1.37 percent to 1.23 percent. Georgia’s share is high by US standards and has also fallen since 2019, when it was 1.66 percent.
Twenty-nine of the 50 states did see electricity spending outpace their own consumption baskets in 2023–2025. The pressure is not imaginary. It is also not a single “data-center state” pattern, and it has not lifted electricity out of the 1-to-2-percent band of the household budget anywhere in the country.
What household spending cannot settle
Data centers buy power on commercial and industrial tariffs, often under special contracts. Their load shows up in household accounts only if regulators pass costs through to residential rates, and only in the years those rates are collected. BEA spending can miss a price spike that households offset by using less electricity, and it can record a larger bill that is really more houses, hotter summers, or more air conditioning. It cannot say whether a Georgia increase was a data-center surcharge, a fuel-cost true-up, or a storm-hardening charge.
The EIA prices in the midterm reporting are a different series. A 20 percent rise in Ohio residential rates over two years is compatible with Ohio’s 19 percent rise in household electricity spending from 2023 to 2025; Michigan’s 6.5 percent spending increase is not a confirmation of the same grouping. None of these annual totals include 2026, the year of the election. If rates jumped again after the 2025 accounts closed, the BEA figures will not yet show it.
What they do show is the starting point the campaign is arguing over. Electricity is a small, recently re-accelerating slice of US consumption. Some of the states in the data-center fight, notably Georgia, Arizona and Ohio, have seen that slice grow faster than the rest of the basket. Virginia, the emblematic data-center state, has not. The household books and the political map are not the same document.
Sources and methods
Figures are from the BEA’s Personal Consumption Expenditures by State (SAPCE) type-of-product table, release bea-sapce-2026-09-30, annual calendar years 1997–2025, millions of current dollars. Electricity is household consumption of electricity (SAPCE3 line 58). The denominator is total personal consumption expenditures in the same table. Per-person electricity spending is electricity divided by implied resident population (total PCE divided by published per-capita PCE). Shares use unrounded values; percentages in the text are rounded. State rankings exclude the District of Columbia. These are retrospective calculations against a snapshot available at research time (1 November 2026); they were not the published accounts on the 31 October 2026 news day, and they do not reconstruct what was known then. SVG charts were rendered from the same figures; they have not been separately checked in a browser.
Research Date
The displayed date matches the related news edition. Research was completed 2026-11-01.
Related news: Daily · 2026-10-31
More Research
Norway’s Data-Center Plans Are Larger Than Its Wind Boom
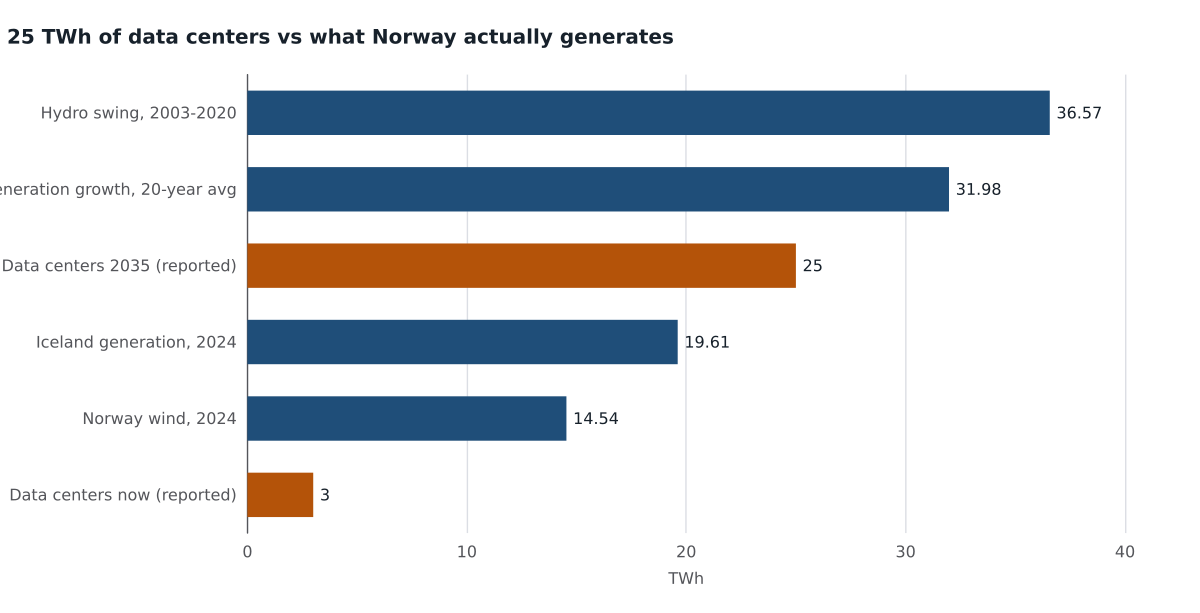
Norway’s reported 25 TWh data-center load is 16 percent of 2024 generation and larger than its wind fleet, on a hydro grid whose dry-year swings already exceed 25 TWh.
America's Expansion Was Spread Across States — And Concentrated In A Few Industries
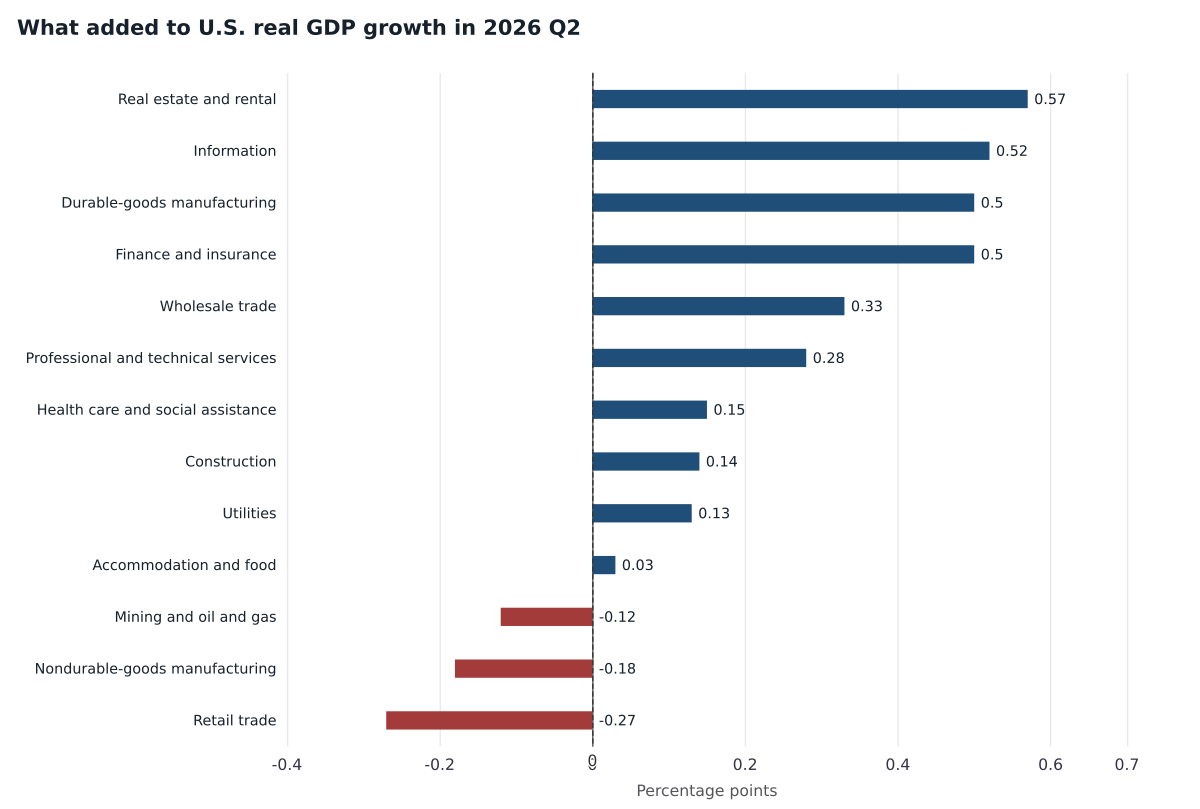
Through mid-2026 the U.S. expansion was geographically broad and industrially narrow: information and durable-goods factories did a large share of the growth; construction and mining did not
The U.S. Elderly Passed Young Children In 2023 — If “Children” Means Under 15
Census 2023 middle-series projections show U.S. people 65+ overtaking ages 0–14 in 2023 — the same comparison China was reported to have crossed in 2025 — while under-18s remain more numerou