LunarWeave
Haiti Is Two-Fifths Poorer Than In 1980. Next Door Is Ten Times Richer.
When Infobae relayed a United Nations warning that more than 250,000 children in Haiti were at risk of acute malnutrition amid violence, the immediate picture was gangs, displacement and clinics that no longer function. Those harms are real, and this research cannot count them. What the macroeconomic record can show is the floor under the warning: Haiti’s real economy has been shrinking for six straight years, and income per person is now about two-fifths below its 1980 level.
That combination — a long decline, then a multi-year contraction, then another year of double-digit inflation — is what a hunger alert looks like in the national accounts. It is not a one-season crop failure sitting on an otherwise intact economy.
A slump that did not start this year
In the IMF World Economic Outlook, Haiti’s real GDP rose modestly through 2018. From 2019 through 2024 it fell every year. The declines were not tiny statistical wobbles. Output dropped 1.7 percent in 2019, 3.3 percent in 2020, then 1.8, 1.7 and 1.9 percent in the next three years. 2024 was the worst of the sequence: real GDP contracted 4.2 percent.
Compounded, that streak leaves the 2024 economy 13.7 percent smaller than in 2018. Population kept rising — from 11.4 million to 12.4 million — so the per-person hit is larger. Constant-price output per resident, measured in gourdes, was 20.5 percent below its 2018 level. The IMF staff still see more contraction in their 2025 and 2026 projections (−2.7 percent and −1.7 percent). Those later years are forecasts, not outturns.
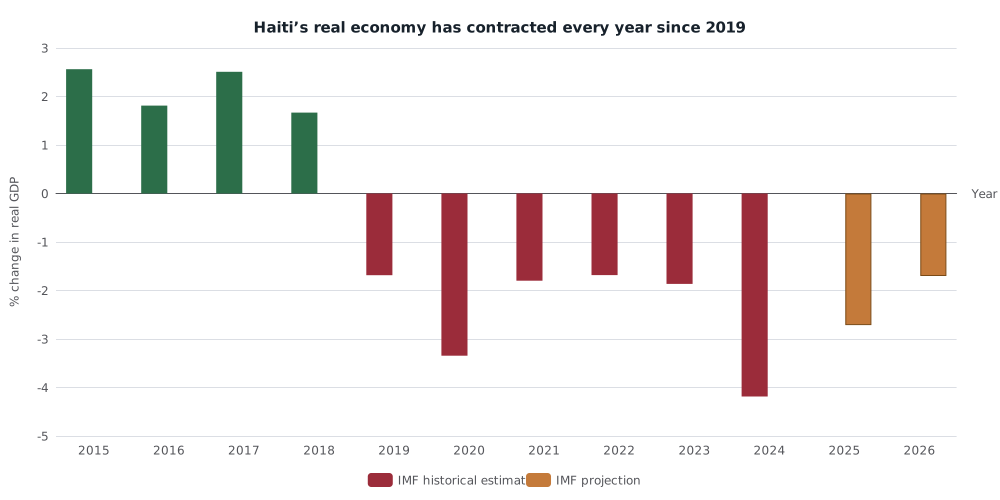
Annual percent change in Haiti’s real GDP, 2015–2026. Bars through 2024 are historical estimates in the IMF World Economic Outlook snapshot; 2025 and 2026 are staff projections. Real GDP is national output, not household income or food availability. Source: IMF WEO series NGDP_RPCH.
Violence, fuel shortages and a collapsing state are the usual explanations for why activity stopped growing. The accounts do not identify the cause. They do establish that the contraction was already in its sixth year when the malnutrition warning was issued, and that 2024 was a deepening, not a first stumble.
Two-fifths poorer than in 1980
The recent slump sits on a much longer erosion of living standards. Haiti’s constant-price GDP per capita at purchasing-power parity was 4,565 international dollars in 1980. In 2024 it was 2,669 — 41.5 percent lower. The same 41.5 percent decline appears in the IMF’s constant-price series in national currency, so the result is not an artefact of how PPP conversion is done.
Over those decades the population more than doubled, from 5.9 million to 12.4 million. More people have been sharing a pie that, per person, is substantially smaller than it was two generations ago. In current US dollars, the entire economy was about $25.3 billion in 2024, or about $2,041 per person at market exchange rates. That dollar figure is not a welfare measure, but it is a reminder of how little tradable income the country generates.
PPP income is still a national-accounts average. It does not say how food is distributed inside Haiti, and it does not measure wasting or stunting. It does say that the typical unit of output available per resident is far below where it was in 1980, and 20.5 percent below 2018.
The other half of the island
Haiti shares Hispaniola with the Dominican Republic. In 1980, Dominican PPP output per person was 1.6 times Haiti’s — a gap, not an abyss. By 2018 the ratio was 6.5. By 2024 it was 9.6. The Dominican figure was 25,645 international dollars; Haiti’s was 2,669.
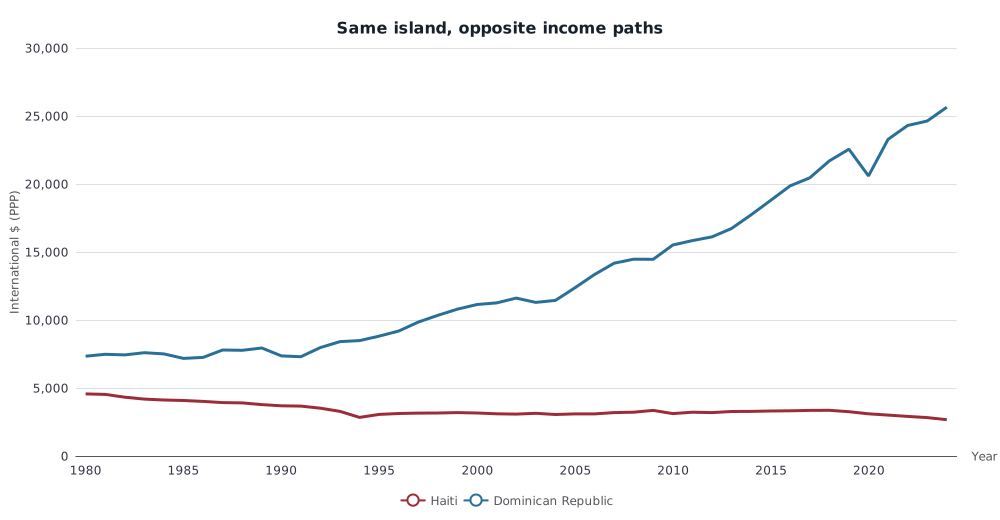
Constant-price GDP per capita in purchasing-power-parity international dollars, Haiti and the Dominican Republic, 1980–2024. IMF WEO series NGDPRPPPPC. Projections for 2025–2026 are omitted. PPP income is not a household survey of food consumption. Choose Haiti or the Dominican Republic in the linked series page; the page does not pre-select a country.
The recent years widened the split rather than pausing it. From 2018 to 2024, Dominican PPP income per person rose 18.2 percent while Haiti’s fell 20.5 percent. Same island, opposite direction.
The pattern is not only a Hispaniola story. Among nearby economies in the same IMF snapshot, Haiti is last. Honduras, at 6,586 international dollars per person, is 2.5 times richer on this measure. Nicaragua is about 7,950. Jamaica is about 11,700. Even Venezuela, after its own collapse, is still 2.8 times Haiti’s level, at 7,529. Costa Rica is in the same range as the Dominican Republic.
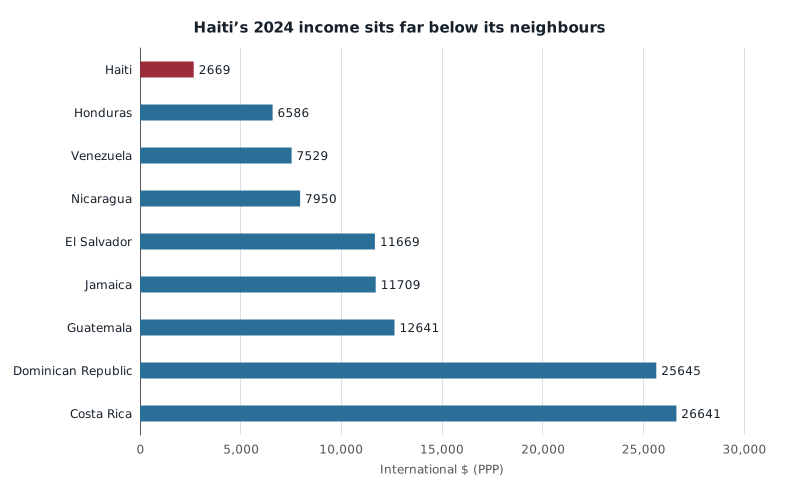
Constant-price PPP GDP per capita, 2024, rounded to the nearest international dollar. IMF WEO series NGDPRPPPPC. Haiti is compared with nearby Latin American and Caribbean economies in the same snapshot. This is output per person, not a direct measure of child hunger.
| Economy (2024) | PPP GDP per capita (international $) | Multiple of Haiti |
|---|---|---|
| Haiti | 2,669 | 1.0 |
| Honduras | 6,586 | 2.5 |
| Venezuela | 7,529 | 2.8 |
| Jamaica | 11,709 | 4.4 |
| Dominican Republic | 25,645 | 9.6 |
A ratio of ten to one on the same island does not, by itself, explain a malnutrition caseload. It does show that Haiti’s poverty is extreme even by the standards of a poor neighbourhood, and that the gap has been getting larger during the current slump.
Prices on top of a shrinking pie
Hunger is a price problem as well as an output problem. IMF average consumer-price inflation in Haiti was already 11.4 percent in 2018. It ran at 44.1 percent in 2023 and 25.8 percent in 2024. Those are not food-price indexes, and they do not isolate rice, oil or cooking fuel. They do mean that a shrinking volume of output was being valued in a currency that was losing purchasing power at rates last associated, in many countries, with crisis years.
The IMF does not publish a child-malnutrition series here, and this snapshot cannot test the UN’s 250,000 figure. What it can say is narrower: families were being asked to feed children from an economy that had already contracted for six years, from incomes per person that had been falling for decades, and through a burst of inflation that peaked above 40 percent in 2023.
What this does not show
None of these series measure armed groups, displacement, aid deliveries or the share of children who are wasted. A reported UN warning is not the same thing as a verified caseload, and GDP is not a kitchen inventory. Cross-country PPP comparisons also compress very different price structures into one international-dollar yardstick; they are the right tool for asking whether Haiti is poorer than its neighbours, not for costing a food basket in Port-au-Prince.
The practical implication is still blunt. If the humanitarian system is responding to a malnutrition emergency in Haiti, it is doing so in a country whose real economy is smaller than it was in 2018, whose income per person is two-fifths below 1980, and whose nearest neighbour has pulled almost ten times further ahead. That is the backdrop, not a substitute for counting hungry children.
Sources and methods
Figures come from an IMF World Economic Outlook snapshot compiled in August 2026. The news that motivated the question is from 18 September 2026; the calculations are retrospective and use a WEO vintage that was not, by itself, a reconstruction of what was knowable that day. Values for 2025 and 2026 are IMF staff projections in this snapshot; 2024 and earlier are treated as historical estimates.
Main series: NGDPRPPPPC (constant-price PPP GDP per capita), NGDP_RPCH (real GDP percent change), NGDPRPC (constant-price GDP per capita in national currency), PCPIPCH (average consumer-price inflation), LP (population), NGDPD and NGDPDPC (current US-dollar GDP and GDP per capita). Official documentation is on the IMF WEO page. Percent changes and ratios were calculated from the published WEO series, not from the charting layer. SVG figures are static renders; they are not a browser or mobile layout check.
The Infobae item is headline-level reporting of a UN warning, not an audit of UN caseload methodology.
Research Date
The displayed date matches the related news edition. Research was completed 2026-09-19.
Related news: Daily · 2026-09-18
More Research
Oil Shocks Alone Rarely Wreck The World Economy. 2026 Starts From A Worse Place.
What 45 years of IMF data say about oil shocks, growth and inflation — and why the September 2026 configuration of a $108 spot price, already-rising world inflation and a resuming Fed resemb
Oil's Speed Problem: What 46 Years Of Brent Data Say About The $120 Shock
The reported $120 oil price is a nominal record but sits far below real peaks of 1980 and 2011–13; what is unprecedented is the speed. IMF Brent data since 1980 show past spikes slowed world
The AI Boom Is Real. The Software-Jobs Boom Isn't.
US payroll data show software employment has shrunk since ChatGPT's launch even as AI valuations and spending boom: 113,700 fewer computer-systems-design jobs, information-sector employment