LunarWeave
Oil Shocks Alone Rarely Wreck The World Economy. 2026 Starts From A Worse Place.
The Federal Reserve raised its benchmark rate by a quarter point on September 17, 2026, to 3.75–4.00 percent — its first hike in three years, taken over the objections of a president demanding cuts, and justified by an inflation reading the bank itself called "elevated" (Dawn). The same day's news carried the reason the hike is awkward: Brent crude reported around $108 a barrel, up roughly half from earlier in the year; Asian liquefied natural gas back near $30 per million BTU; and a Reuters warning about rising oil, rates and yields brewing a "stagflation cocktail" for markets (Yeni Şafak; Reuters).
"Stagflation" — stagnant growth combined with fast-rising prices — is the nightmare scenario people reach for whenever oil spikes. It is worth asking, carefully, what the historical record actually shows. When crude has jumped as sharply as it is jumping now, what happened to world growth and world inflation? And is 2026's setup similar to the episodes that ended badly?
The answer, drawn from 45 years of International Monetary Fund data, is double-edged. Oil shocks, by themselves, have rarely been enough to derail the world economy. What made them dangerous was what they landed on — and the inflation landscape of late 2026 looks more like the dangerous configurations than the benign ones.
How unusual is a $108 barrel?
The IMF's World Economic Outlook is the best long, consistent record of both energy prices and the macroeconomic outcomes people worry about. Its April 2026 edition, the latest vintage used here, puts the average Brent price at $68.3 a barrel in 2025 — actually down 14.5 percent from 2024 — and projected a 2026 average of $80.2, a 17.4 percent rebound (IMF World Economic Outlook).
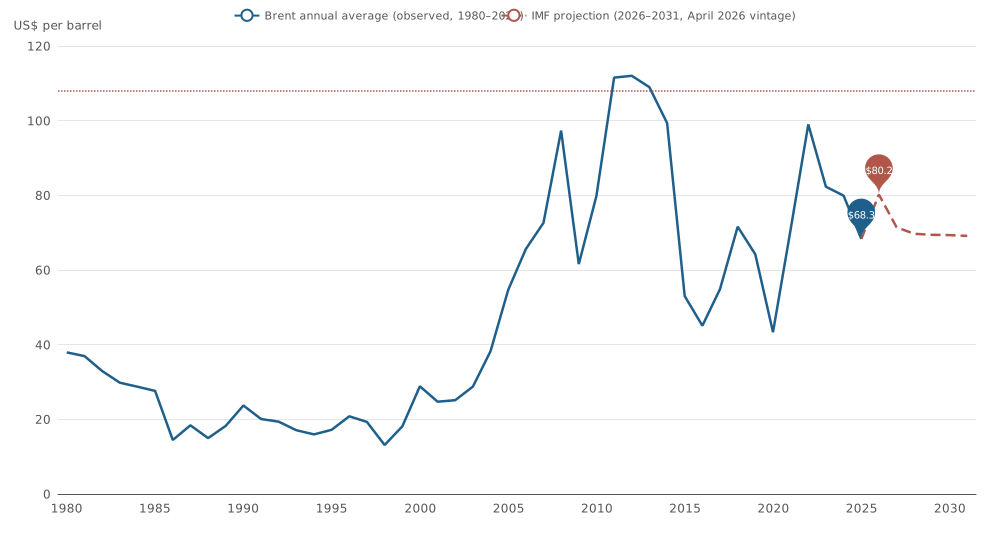
The $108 barrel being reported in September is a spot level, not an annual average, and the two should not be conflated. But the gap is the story. A barrel at $108 is 58 percent above the 2025 annual average and 35 percent above the IMF's full-year projection made just five months earlier. Only three years in the whole 45-year record produced higher annual averages — 2012 ($112.0), 2011 ($111.5) and 2013 ($109.0). If oil held anywhere near $108 through the rest of the year, the 2026 annual jump would be around 58 percent — the third-largest in the 45-year record, behind only 2021's 63.5 percent rebound from the pandemic collapse and 2000's 59.3 percent.
Natural gas tells the same story. The IMF's Japan LNG benchmark — the standard proxy for Asian gas — averaged $12.1 per million BTU in 2025, and the April projection put 2026 at about $15. A reported spot price near $30 is roughly double that full-year assumption, approaching the record annual average of $33.3 set in 2022 during the last global energy crisis (Dawn). Whatever the April models assumed, the September market is pricing a materially bigger shock.
What the 45-year record says about shock years
Define a shock year plainly: any year from 1980 through 2025 in which the Brent annual average rose at least 25 percent. There are twelve of them: 1987, 1990, 1999, 2000, 2004, 2005, 2008, 2010, 2011, 2018, 2021 and 2022. For each, compare world GDP growth and world average consumer-price inflation in the year before the shock and the year after.
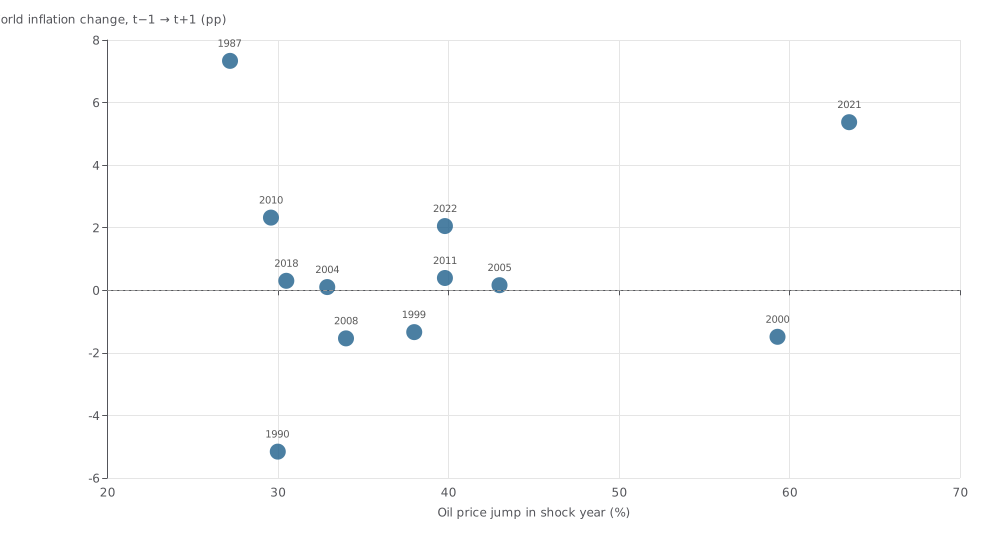
The median shock year is remarkably survivable. World inflation rose by just 0.2 percentage points from the year before the shock to the year after (the median); the rise was concentrated in the shock year itself — a median 1.2 points — with the following year typically easing again. World growth, on the same comparison, fell by a median of 0.4 percentage points. In the two mildest cases — 2004 and 2005, when crude jumped 33 and 43 percent — world inflation stayed near 4 percent (3.8–4.0 percent across 2003–2006) while growth rose from 3.8 percent in 2003 to between 4.7 and 5.3 percent over 2004–2006. The 2011 shock, which took annual average prices to what are still near-record levels, added less than half a point to world inflation over two years.
| Shock year | Brent jump | World growth, yr before → yr after | World inflation, yr before → yr after |
|---|---|---|---|
| 1987 | +27.2% | 3.4% → 4.5% (+1.2 pp) | 11.7% → 19.1% (+7.3 pp) |
| 1990 | +30.0% | 3.7% → 2.5% (−1.3 pp) | 22.0% → 16.8% (−5.2 pp) |
| 1999 | +38.0% | 2.6% → 4.8% (+2.2 pp) | 6.3% → 5.0% (−1.4 pp) |
| 2000 | +59.3% | 3.6% → 2.5% (−1.1 pp) | 6.2% → 4.7% (−1.5 pp) |
| 2004 | +32.9% | 3.8% → 4.7% (+0.9 pp) | 3.9% → 4.0% (+0.1 pp) |
| 2005 | +43.0% | 5.3% → 5.3% (+0.0 pp) | 3.8% → 3.9% (+0.2 pp) |
| 2008 | +34.0% | 5.4% → −0.4% (−5.7 pp) | 4.2% → 2.6% (−1.6 pp) |
| 2010 | +29.6% | −0.4% → 4.1% (+4.5 pp) | 2.6% → 4.9% (+2.3 pp) |
| 2011 | +39.8% | 5.3% → 3.4% (−1.9 pp) | 3.6% → 4.0% (+0.4 pp) |
| 2018 | +30.5% | 3.8% → 3.0% (−0.9 pp) | 3.3% → 3.6% (+0.3 pp) |
| 2021 | +63.5% | −2.7% → 3.8% (+6.5 pp) | 3.3% → 8.7% (+5.4 pp) |
| 2022 | +39.8% | 6.7% → 3.3% (−3.3 pp) | 4.7% → 6.7% (+2.0 pp) |
World aggregates, IMF WEO (April 2026 vintage). "Year before" and "year after" are t−1 and t+1 around each shock year. Caveats below the table apply strongly: several of these windows overlap with events that had nothing to do with oil.
The averages, however, hide the reason the current situation deserves respect. Look at when shocks went wrong. The 1987 shock added more than 7 points to world inflation — but in a world where inflation was already running at nearly 12 percent, with dozens of developing economies devaluing through debt crises. The 2008 shock preceded a 5.7-point growth collapse — but the collapse was the global financial crisis, and by 2009 oil had crashed instead. And the 2021 shock, the largest price jump in the record, produced the biggest inflation response of the modern low-inflation era: world inflation nearly tripled to 8.7 percent, because a +63.5 percent oil shock landed on an economy already straining against pandemic reopening, supply bottlenecks and stimulus.
The pattern is consistent: the size of the price jump explains little. What matters is the macroeconomic condition of the world when the shock arrives. A shock hitting a stable, low-inflation expansion (2004–05) gets absorbed. A shock confirming an existing inflationary impulse (2021–22), or arriving amid financial fragility (2008), becomes something else entirely.
Where 2026 sits
That distinction is what makes the September 2026 configuration uncomfortable. The IMF's April baseline already assumed the easy part was over: world growth slowing from 3.4 percent in 2025 to 3.1 percent in 2026, and world inflation — which had been falling steadily since the 2022 peak — ticking back up from 4.1 to 4.4 percent (MacroVedia's IMF-based data page for world inflation shows the same series; readers select the World aggregate in the chart). US consumer-price inflation was projected to rise from 2.7 to 3.2 percent, straying from the Fed's 2 percent target — precisely the "elevated" inflation the FOMC cited for its hike (world GDP growth series on MacroVedia).
In other words, the energy shock is not arriving on the flat, low-inflation base of 2004. It is arriving while world inflation has already stopped falling and started turning up, and while a major central bank has just resumed tightening — a configuration history flags as the hazardous kind. Two qualifications keep this honest. First, none of this is a prediction: the April vintage's 2026 numbers are projections, and the September spot prices are news reports, not outcomes; if the spike subsides quickly, 2026 could still average near the IMF's $80 assumption. Second, correlation is not causation — oil spikes are often symptoms as much as causes, as 1990's Gulf War and 2008's financial crisis remind us, so no one can isolate what an oil shock alone does to the world.
What the record does justify is this: the fear attached to the phrase "stagflation cocktail" is not about the oil shock alone. Twelve previous jumps of a quarter or more mostly passed without disaster. The worry is the landing. And 2026 is landing on the same kind of surface — already-rising inflation, already-slowing growth, central banks already turning — that turned previous shocks into the worst inflation surges of the past half-century.
Methods and sources. This is a retrospective research piece: written September 18, 2026, in response to the September 17, 2026 news, using the pinned IMF World Economic Outlook snapshot in our catalogue (April 2026 WEO edition, snapshot taken August 24, 2026). Annual values for 1980–2025 are treated as observed; 2026–2031 values are IMF projections from that edition. All price series are nominal US$ annual averages and are not inflation-adjusted; annual averages smooth intra-year spikes, so a September spot of $108 and a 2026 annual average near $108 are different things — comparisons in the text treat them accordingly. Shock years are defined as annual-average Brent increases of 25 percent or more (12 episodes, 1980–2025). Episode windows overlap with non-oil events (the 2008–09 financial crisis, the 2020–21 pandemic), so episode outcomes are not causal estimates. MacroVedia pages are third-party visualizations of the IMF series; the underlying source is the IMF World Economic Outlook.
Research Date
The displayed date matches the related news edition. Research was completed 2026-09-18.
Related news: Daily · 2026-09-17
More Research
Oil's Speed Problem: What 46 Years Of Brent Data Say About The $120 Shock
The reported $120 oil price is a nominal record but sits far below real peaks of 1980 and 2011–13; what is unprecedented is the speed. IMF Brent data since 1980 show past spikes slowed world
The AI Boom Is Real. The Software-Jobs Boom Isn't.
US payroll data show software employment has shrunk since ChatGPT's launch even as AI valuations and spending boom: 113,700 fewer computer-systems-design jobs, information-sector employment
The Border Surge Ended. Florida's Detention Boom Had A Different Engine
When the Department of Homeland Security's inspector general reported this month that detainees at the now-closed "Alligator Alcatraz" centre in Florida had been held in…