LunarWeave
The 100% Global-Debt Line Is A 2029 Forecast. China Is The One Crossing It Now.
In Singapore on 7 October 2026, IMF managing director Kristalina Georgieva told governments in the large economies to make “very tough choices.” The Guardian reported her saying that global debt-to-GDP ratios were at their highest since the second world war and on course to hit 100 percent in the coming years. Izvestia carried the same remarks as a forecast that combined government debt would exceed 100 percent of world GDP.
Those two numbers — a wartime high, a round 100 percent — are easy to hear as a fact about the world as it stands. They are not, at least not in the IMF’s own World Economic Outlook books. A GDP-weighted blend of the Fund’s advanced-economy and emerging-market groups puts world general government gross debt at 92.0 percent of GDP in 2024, the last historical year in this snapshot. The 2026 projection is 95.3 percent. The constructed world ratio first reaches 100 percent only in 2029. And 2020 was higher than any of those later years.
The 100 percent line is real as a medium-term projection. It is not a description of a typical country, and it is not a new peak relative to the pandemic.
The world average is still below the COVID spike
The IMF does not publish a World observation for this debt-ratio series in the pinned snapshot, so the world figure here is built from the two groups that partition world output: advanced economies and emerging market and developing economies, weighted by GDP in current dollars. Those two GDP series sum to the Fund’s World GDP in every year of the sample.
On that measure, world government debt was 59.1 percent of GDP in 2007, jumped to 97.3 percent in 2020, then fell back to 89.2 percent in 2022 as the pandemic shock aged and nominal GDP recovered. By 2024 it had climbed only to 92.0 percent — 5.4 points below the 2020 peak. The 2026 projection, 95.3 percent, is still about two points short of 2020. The path hits 98.7 percent in 2028 and 100.0 percent in 2029, then 101.2 percent in 2030.
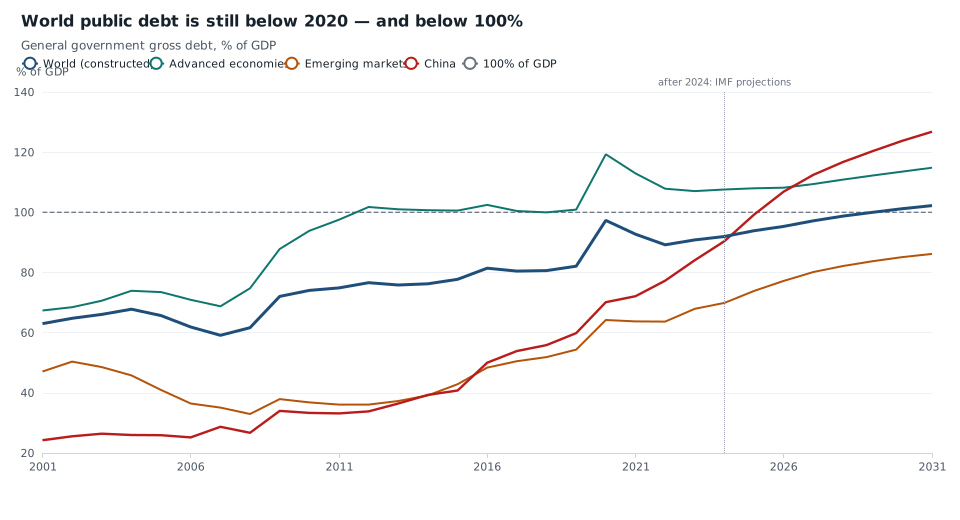
General government gross debt as a percent of GDP, 2001–2031. World is a current-dollar GDP-weighted blend of IMF advanced-economy and emerging-market groups; the Fund’s World aggregate has no observations for this series here. 2025 is an IMF estimate; 2026–2031 are projections. Source: IMF World Economic Outlook.
This snapshot cannot test the wartime comparison. The constructed world series begins in 2001, and the underlying WEO file does not run back to 1945. What it can test is the 100 percent claim, and whether “highest since the war” is being used for a ratio that has already been higher in the twenty-first century. On the second point, 2020 still leads.
| Year | World (constructed) | Advanced economies | Emerging markets | China |
|---|---|---|---|---|
| 2020 | 97.3 | 119.3 | 64.2 | 70.1 |
| 2024 | 92.0 | 107.6 | 69.9 | 90.4 |
| 2026* | 95.3 | 108.2 | 77.2 | 106.9 |
| 2030* | 101.2 | 113.5 | 85.1 | 123.8 |
*2026 and 2030 are IMF projections in the August 2026 snapshot; 2024 is the last historical year. Figures are percent of GDP.
Rich countries already live above the line. Most others do not.
Advanced economies as a group first crossed 100 percent of GDP in 2012. They have been around or above that line ever since, aside from 99.98 percent in 2018. COVID then took them to 119.3 percent in 2020. The 2024 reading is 107.6 percent; the 2026 projection is 108.2 percent. They are not racing through 100 percent. They have been living there for more than a decade, and they are still well below the pandemic spike.
Emerging markets are a different patient. Their ratio was 35.1 percent of GDP in 2007 and 54.4 percent in 2019. It is 69.9 percent in 2024 and is projected at 77.2 percent in 2026 and 85.1 percent in 2030 — still below 100 percent at the end of the forecast, but already above the 2020 high of 64.2 percent. The post-COVID climb in the world average is coming from this group, not from a new advanced-economy blowout.
That split is why a 100 percent world figure is a poor description of most places. In the 2026 projections, Japan is at 204.4 percent of GDP and the United States at 125.8 percent. The euro area is at 87.8 percent. India is at 83.4 percent and still drifting down. Sub-Saharan Africa is at 38.4 percent — higher than in 2024, and nowhere near the global headline.
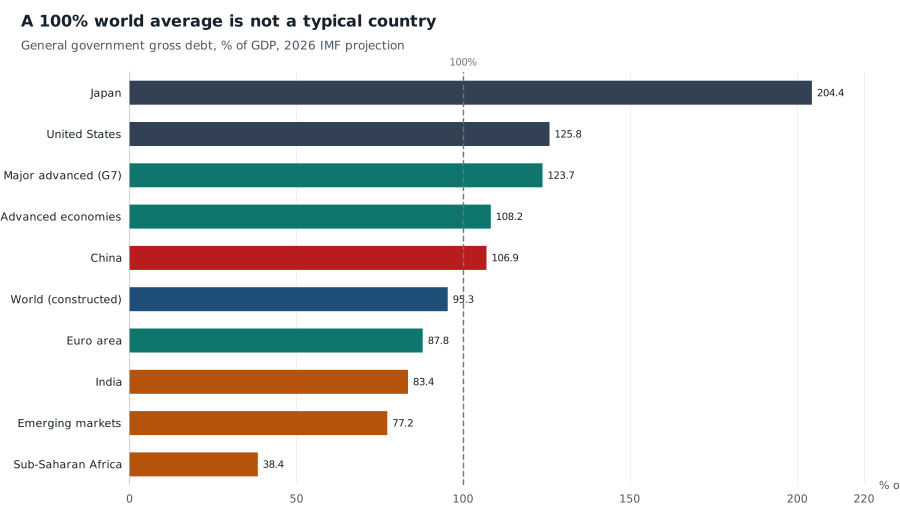
General government gross debt as a percent of GDP, 2026 IMF projections. World is the same GDP-weighted blend as above. Japan’s ratio is more than five times Sub-Saharan Africa’s. Source: IMF World Economic Outlook.
A GDP-weighted world average is supposed to be pulled by the giants. In 2024, the United States, China and Japan together accounted for 60.3 percent of the constructed world debt stock — 34.9, 16.7 and 8.8 percent — against 26.3, 17.0 and 3.8 percent of world GDP. Three borrowers can make a planetary ratio look like a planetary condition.
China is the crossing that is on the calendar now
If any large economy is actually moving through 100 percent in this vintage, it is China, not “the world.”
China’s general government debt was 59.8 percent of GDP in 2019 and 90.4 percent in 2024. The 2025 estimate is 99.2 percent, still a hair under the line. The 2026 projection is 106.9 percent; by 2030 it is 123.8 percent. That is a 47.1 point rise in seven years through 2026, and another 33.4 points from 2024 to 2030. Emerging markets as a whole rise 15.2 points over that later window; advanced economies rise 6.0. The world average’s 9.2 point projected increase from 2024 to 2030 is, in large part, China showing up in a GDP-weighted sum.
The dollar stock tells the same story from the other side. Between 2019 and 2026, the constructed world debt stock rises by an estimated $47.7 trillion. The United States accounts for 36.2 percent of that increase and China for 28.4 percent. Together they are 64.6 percent of the added stock. The United States remains the larger debtor. China is the one whose ratio is breaking a new threshold.
None of this says China is “the” fiscal crisis, or that Sub-Saharan Africa’s 38 percent ratio is comfortable. Interest costs, currency mismatches and rollover risk do not show up in a gross-debt ratio. It does say that treating 100 percent of world GDP as a single alarm, as if every finance ministry were approaching the same cliff, flattens the only fact the WEO makes obvious: the rich world already borrowed through that line, and the next crossing in the Fund’s tables belongs to China.
What the 100 percent figure cannot do
Georgieva’s operational point was about budget arithmetic in large, already-indebted economies — rising yields, an interest bill that competes with defence, and a preference for a “prudently hawkish” monetary stance while AI investment and resource prices keep inflation warm. A world ratio that is still below 2020 does not refute that narrower warning. The United States is projected at 125.8 percent of GDP in 2026 with the ratio still rising. Japan’s ratio is falling in this vintage, from 214.5 percent in 2024 to 204.4 percent in 2026, and remains in a class of its own.
What the 100 percent line cannot do is stand in for those country facts. It is a weighted average, not a median. It is gross debt of general government, not net debt, not household or corporate debt, and not the US federal-debt number that dominates American headlines. A falling ratio is not the same as paying the stock down. And a projection that first prints 100.0 percent in 2029 is a statement about the IMF’s assumed deficits and growth, not a measurement of 2026.
This is retrospective research. The news is from 7 October 2026; the calculations use a pinned WEO snapshot ingested in August 2026, whose 2025 values are estimates and whose 2026–2031 values are projections. Georgieva was speaking ahead of the Fund’s annual meetings, which often bring a new WEO and Fiscal Monitor. Those later vintages can revise the path. They cannot change the distinction this vintage already draws: the world average is not yet at 100 percent, it was higher in 2020, and the large economy actually crossing the line in the forecast is China.
Sources and methods. Debt ratios are IMF WEO series GGXWDG_NGDP, general government gross debt as a percent of GDP. World figures are constructed as (advanced-economy ratio × advanced GDP + emerging-market ratio × emerging GDP) / (advanced + emerging GDP), using current-dollar GDP (NGDPD). Group codes follow standard WEO numbering, checked against 2024 GDP scale, because the local geography dictionary has blank names. Country figures can be explored on the MacroVedia debt-ratio page; choose the country in the chart. Official definitions and the database remain with the IMF World Economic Outlook.
Research Date
The displayed date matches the related news edition. Research was completed 2026-10-08.
Related news: Daily · 2026-10-07
More Research
Finland’s Data-Center Freeze Is About Forests. The Power Is Nuclear And Wind.
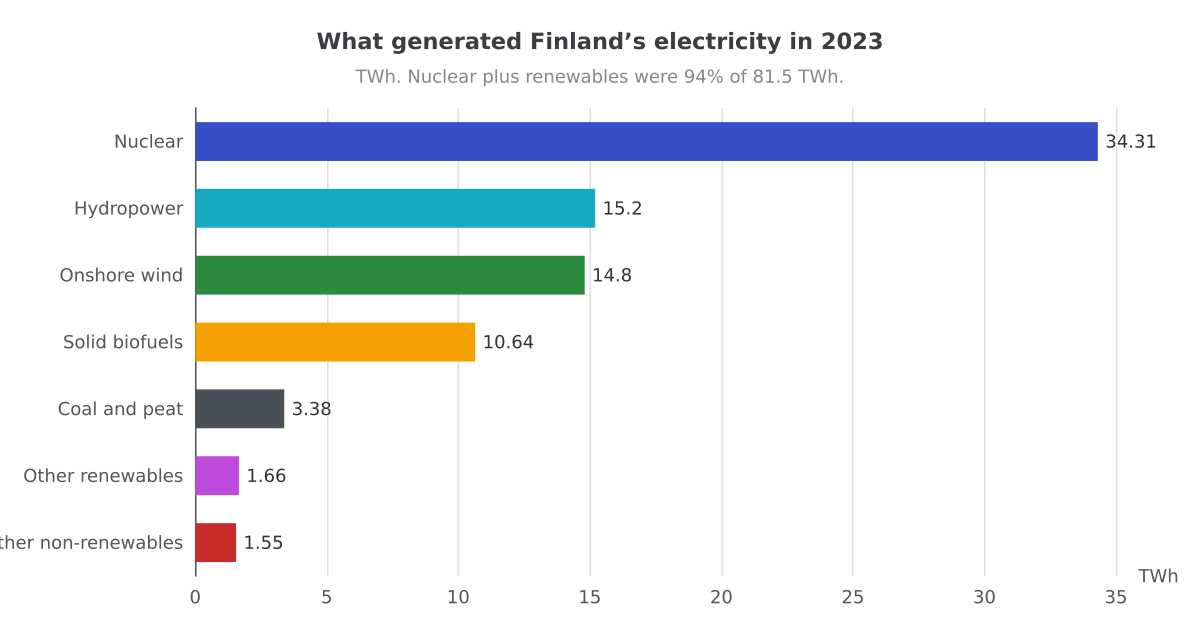
Google’s Finnish data-center pause is a forest and permitting fight. IRENA accounts show a nuclear-and-wind grid that still counts wood as renewable.
Brazil’s 8 Percent Deficit Is An Interest Bill
IMF accounts show Brazil’s projected 8% of GDP headline deficit is almost entirely interest; the primary deficit is near zero while public debt returns toward its 2020 peak.
Hospitals Kept Hiring. Finance Started Shrinking.
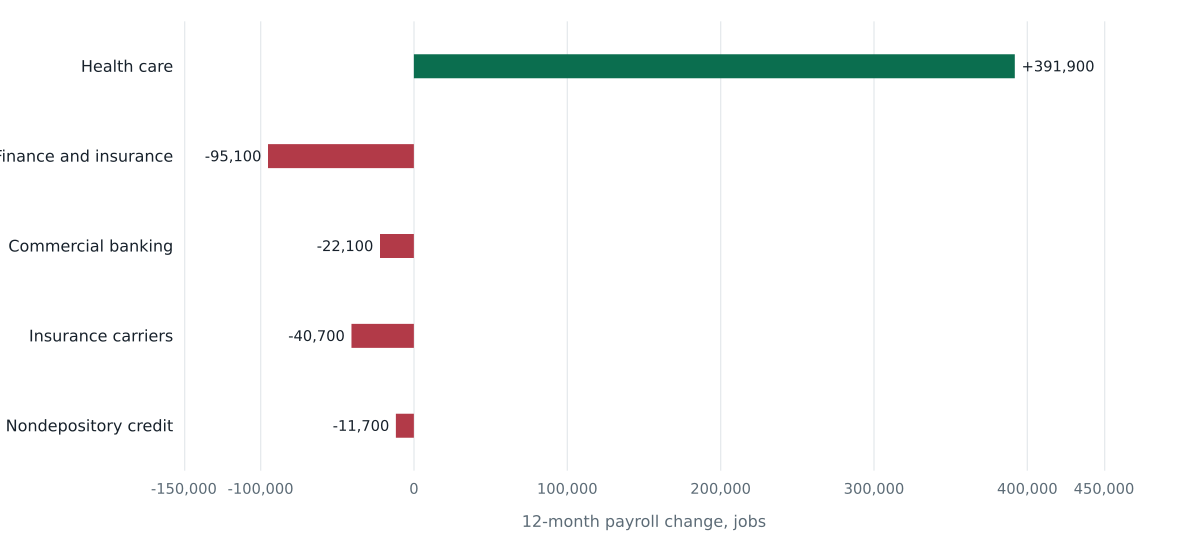
Through July 2026, U.S. health care added more jobs than the entire net payroll gain while finance and insurance lost 95,100. Banks and insurers, not leftover mortgage lenders, account for t