LunarWeave
The Fuel Bill Is National. The Oil Paycheck Is Texas.
A fuel-price spike is a blunt political instrument because almost every American household buys gasoline. It is a much narrower economic transfer than that sounds. The extraction industry that would collect a windfall from high crude prices is not spread across the map. In 2025, Texas alone accounted for 64 percent of U.S. oil-and-gas extraction GDP.
That distinction matters if high oil prices are meant to squeeze voters. Reuters, citing senior Iranian sources, has described attacks on shipping in the Strait of Hormuz as a way to keep oil expensive ahead of U.S. midterm elections. Separate reporting put September U.S. consumer-price inflation at 3.7 percent and attributed the pickup largely to fuel. This article does not re-estimate the consumer-price index. It asks a different question, with Bureau of Economic Analysis accounts: when oil is expensive, how widely is the household fuel bill spread, and how concentrated is the producer income that could offset it?
A small bill, paid almost everywhere
Motor vehicle fuels, lubricants, and fluids were 1.9 percent of U.S. personal consumption expenditures in 2025 — $390 billion out of $20.9 trillion. Add heating fuels and other energy goods and the share is still 2.0 percent. That is not a trivial line on a household budget, and it is large enough to move a monthly inflation print. It is also not the 2008 or 2011 peak, when the same motor-fuel category reached 3.6 percent of spending.
The more important feature is geographic. In every state, motor fuels were a measurable slice of consumption in 2025, and nowhere were they a dominant one. The range ran from 0.9 percent of spending in Hawaii and 0.9 percent in New York to 3.2 percent in Iowa and 3.0 percent in Nebraska. Texas households, sitting on top of the country’s largest oil industry, still spent 2.2 percent of their consumption on motor fuels — a bit above the national share, not a different universe.
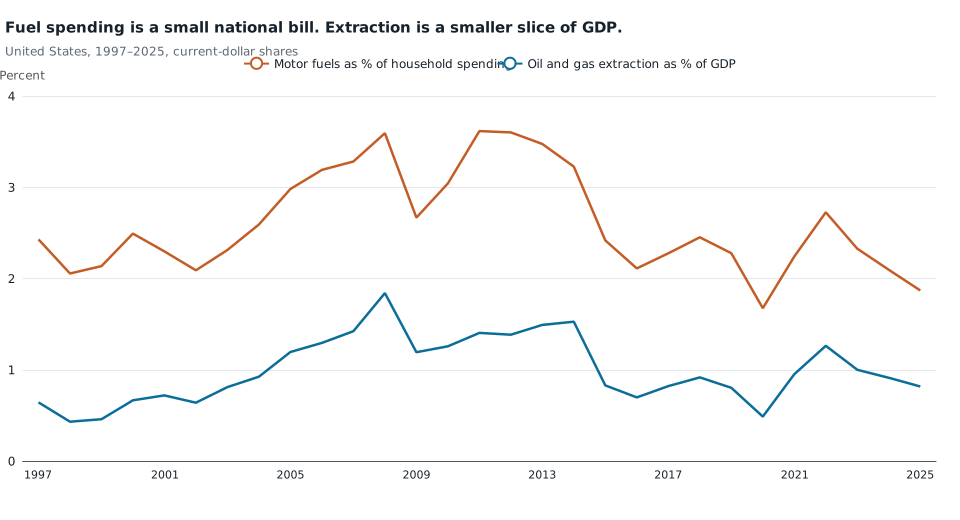
United States, 1997–2025. Motor vehicle fuels, lubricants, and fluids as a percent of total personal consumption expenditures, and oil-and-gas extraction as a percent of all-industry GDP, both in current dollars. These are different accounts. Source: U.S. Bureau of Economic Analysis.
Oil-and-gas extraction is smaller still as a share of the national economy: $252 billion, or 0.82 percent of U.S. GDP, in 2025. The two percentages should not be subtracted from each other. One is household spending on refined products; the other is value added in pulling crude oil and natural gas out of the ground. They are useful together only as a reminder of scale. A fuel spike can be politically loud without being a large share of either consumer spending or national output.
Two-thirds of the extraction economy is one state
The producer side is not national. Texas generated $160 billion of oil-and-gas extraction GDP in 2025 — 63.75 percent of the U.S. total. Oklahoma was second, at 8.0 percent. New Mexico, Colorado, and Pennsylvania filled out the top five. Those five states together were 85 percent of American extraction. The top ten were 97 percent.
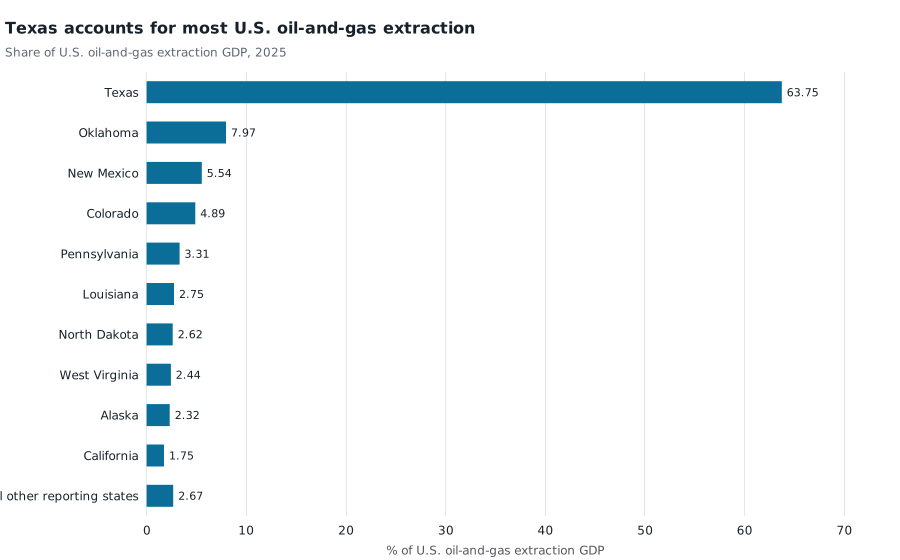
Share of U.S. oil-and-gas extraction GDP in current dollars, 2025. Residual bar is other reporting states; Wisconsin’s extraction value is suppressed and is not treated as zero. Source: U.S. Bureau of Economic Analysis, GDP by state.
That concentration is not the same thing as an oil-state identity. Extraction was 5.5 percent of Texas GDP — large for a $2.9 trillion economy, but not a majority. The states where extraction is a bigger piece of local output are smaller: New Mexico (9.2 percent of its own GDP), North Dakota (8.0 percent), Alaska (7.9 percent), and Oklahoma (7.3 percent). West Virginia, Wyoming, Colorado, and Louisiana complete a nine-state group at or above 2 percent of their own economies. In 34 of 50 reporting areas, including the District of Columbia, extraction was under 0.1 percent of GDP. Wisconsin’s figure is suppressed.
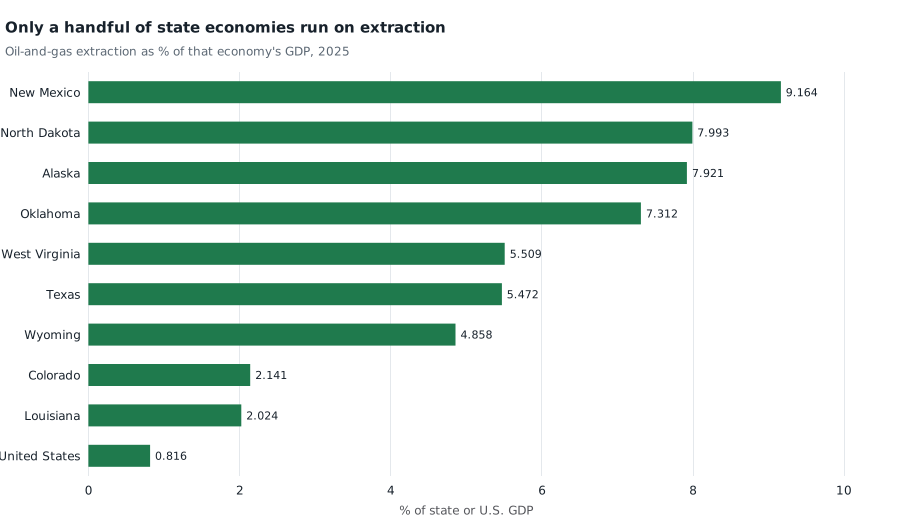
Oil-and-gas extraction as a percent of that geography’s current-dollar GDP, 2025. Nine states were at or above 2 percent. The U.S. figure is 0.82 percent. Extraction is NAICS 211 and excludes refining. Source: U.S. Bureau of Economic Analysis, GDP by state.
Iowa illustrates the mismatch. Its households spent 3.2 percent of consumption on motor fuels, the highest share in the country. Its oil-and-gas extraction GDP was $0.4 million, a rounding error beside a $272 billion state economy. New York spent 0.9 percent of consumption at the pump and produced $34 million of extraction GDP — 0.001 percent of a $2.5 trillion economy. A high oil price is a consumer event in both places. It is not a local paycheck.
| Geography (2025) | Motor fuels as % of spending | Oil and gas extraction as % of GDP | Share of U.S. extraction GDP |
|---|---|---|---|
| United States | 1.9 | 0.82 | 100 |
| Texas | 2.2 | 5.5 | 63.75 |
| Oklahoma | 3.0 | 7.3 | 8.0 |
| New Mexico | 2.6 | 9.2 | 5.5 |
| Iowa | 3.2 | ~0 | ~0 |
| New York | 0.9 | ~0 | ~0 |
Figures are current-dollar shares. Iowa extraction GDP was $0.4 million; New York’s was $34 million. Source: BEA.
The 2026 dollar rebound is still a Texas story
Annual extraction accounts stop in 2025, so they cannot describe September 2026 pump prices. Quarterly GDP can describe the first half of 2026, with a wider lens. The BEA’s quarterly industry is mining, quarrying, and oil and gas extraction — NAICS 21, which includes coal, metal mining, and support services, not just wells. Those figures are seasonally adjusted annual rates.
On that broader measure, U.S. mining GDP rose from a $379 billion annual rate in 2025 Q4 to $518 billion in 2026 Q2. Texas went from $188 billion to $256 billion and remained about half of the U.S. mining total, as it has since 2019. A current-dollar jump of that size is consistent with a price shock landing in producer accounts. It is not a direct reading of crude volumes, gasoline CPI, or how much of September’s inflation print was fuel. It also does not spread the gain: even in the broader mining aggregate, Texas still takes about one dollar in two.
Real annual extraction data add one more caution. In 2022, the last big price year in this series, oil-and-gas extraction GDP peaked at $329 billion in current dollars while real output, in chained 2017 dollars, was weaker than in 2019 or 2020. By 2025, real extraction output was 43 percent above 2019, but the current-dollar value had fallen 24 percent from the 2022 peak. High prices and high volumes are not the same event. The 2026 rebound visible in quarterly mining dollars looks more like the former.
What the accounts cannot say
None of this measures how voters will respond to gasoline prices, or whether a Hormuz campaign can hold oil expensive through an election. Extraction GDP is not oil-company profit, not state tax revenue, and not household income in Midland or Odessa. It excludes refining, which is a different industry and a different map. Motor-fuel spending is a current-dollar total, so it mixes price and gallons; a falling share can mean cheaper fuel, less driving, or both.
The accounts do settle a more limited point. If the political theory of a fuel spike is that it inflicts nationwide pain, the consumer data agree: every state buys motor fuel, and some of the highest spending shares are in places with no oil industry. If the economic theory is that America as a whole cashes the other side of the trade, the producer data do not. Most of the extraction income sits in Texas. A handful of smaller energy states feel it as a local engine. The rest of the country meets expensive oil at the pump.
Sources and methods
This is retrospective research completed on 15 October 2026, the day after the 14 October 2026 news. Figures use pinned BEA state GDP and PCE snapshots whose source-release identifier is 30 September 2026: annual data through 2025 and quarterly GDP through 2026 Q2. Those annual accounts still end before the September 2026 consumer-price print.
Oil-and-gas extraction is NAICS 211 in the BEA’s annual GDP-by-state table (SAGDP2). Motor fuels are “motor vehicle fuels, lubricants, and fluids” in state PCE by type of product (SAPCE3), divided by total PCE in the same table. Quarterly mining is NAICS 21 in SQGDP2, seasonally adjusted at annual rates. Wisconsin’s 2025 extraction value is suppressed; it is omitted, not zeroed. State extraction values sum to the published U.S. total. Shares are calculated from current dollars; chained-dollar industry totals are not additive and are used only for the U.S. real-output comparison.
Primary sources: BEA GDP by state, BEA PCE by state, and the BEA regional methodology. News cited as reporting, not as verified statistics: Reuters via Rzeczpospolita on Hormuz and oil prices; El Comercio on the September CPI print.
Research Date
The displayed date matches the related news edition. Research was completed 2026-10-15.
Related news: Daily · 2026-10-14
More Research
California Already Collects A Quarter Of America's State Income Taxes
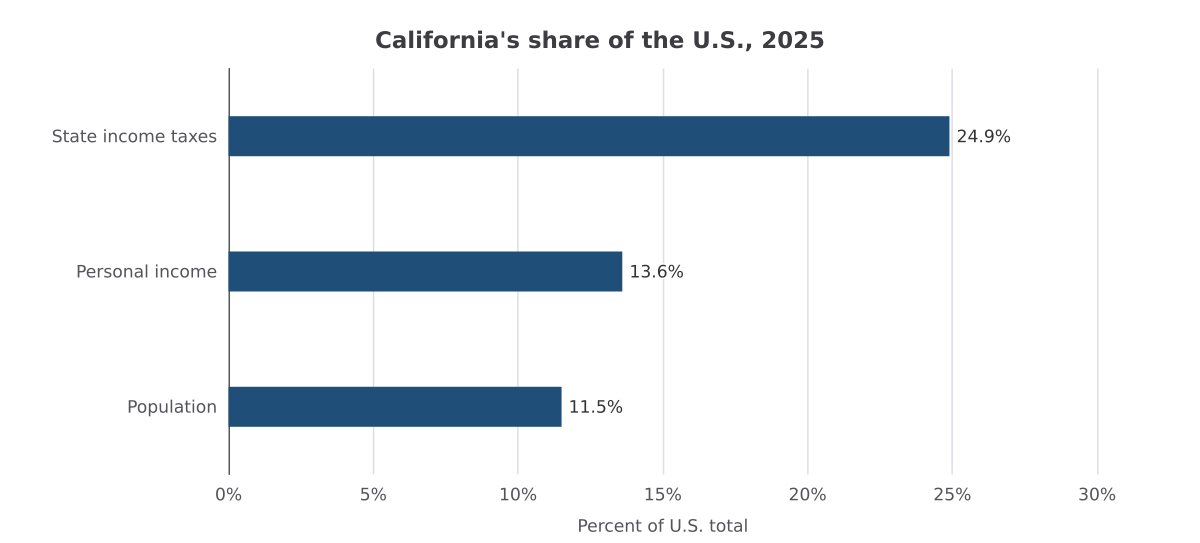
California collected a quarter of U.S. state income taxes in 2025 with 11.5% of the population, then watched those receipts fall a fifth while personal income kept rising.
Yemen's Electricity Already Runs On Oil
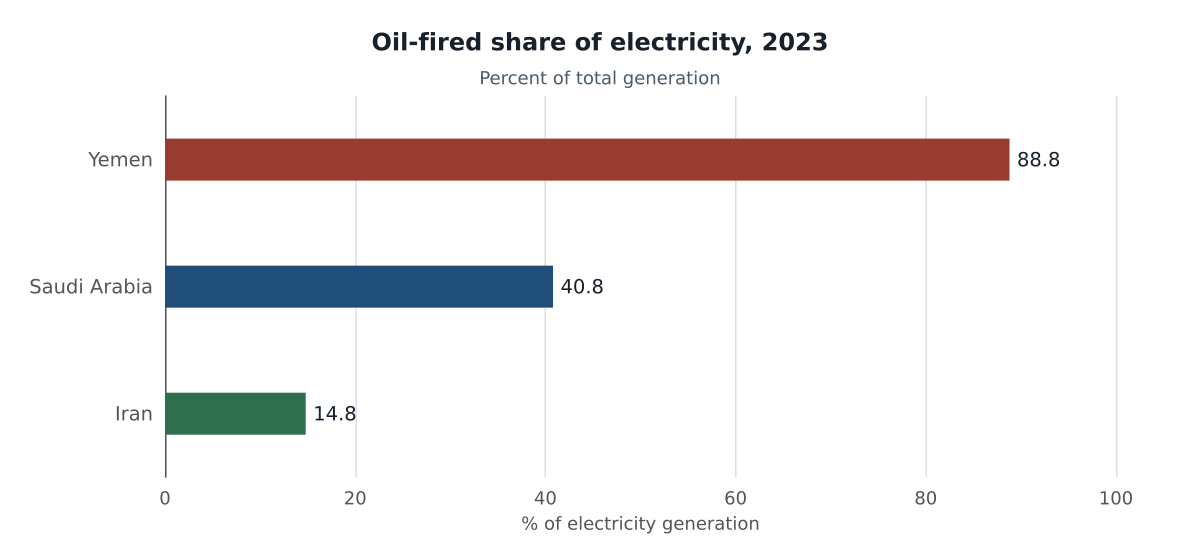
IRENA generation data show oil supplied 88.8% of Yemen's electricity in 2023 after gas-fired output collapsed, versus 40.8% in Saudi Arabia and 14.8% in Iran.
Half The World's Solar Capacity Now Sits In China
China generated 40 percent of the world's solar electricity in 2024 and hosted half of installed solar capacity by the end of 2025, a share that has been rising since 2015.