LunarWeave
The Ceuta Fence Sits On An Eight-To-One Income Cliff
When tens of thousands of people rushed the Spanish enclave of Ceuta at the end of July 2026, Madrid reached for more concrete. The Associated Press reported that between 50,000 and 60,000 people crossed from Morocco in a few days, that at least 67 died, and that Spain would build a 500-metre sea barrier. Deutsche Welle reported that Prime Minister Pedro Sánchez demanded an emergency European meeting and called other governments selfish after Italy moved to suspend Schengen cooperation.
Whatever triggered the rush, Ceuta is not a labour-market oasis next to a uniquely jobless country. It is a European city on the African mainland, sitting on an income gap that has barely moved in a decade.
In 2024, the IMF World Economic Outlook put Spain’s GDP per capita in current US dollars at $35,151 and Morocco’s at $4,298. Spain produced about 8.2 times as much dollar output per person. Choose Spain or Morocco on that series page; the 2019 and 2024 points match the figures used here.
That is national output per resident, not the wage of someone who swims around a breakwater. It is still the right scale for the question the fence is being asked to answer: how large is the economic gradient at Spain’s North African land borders?
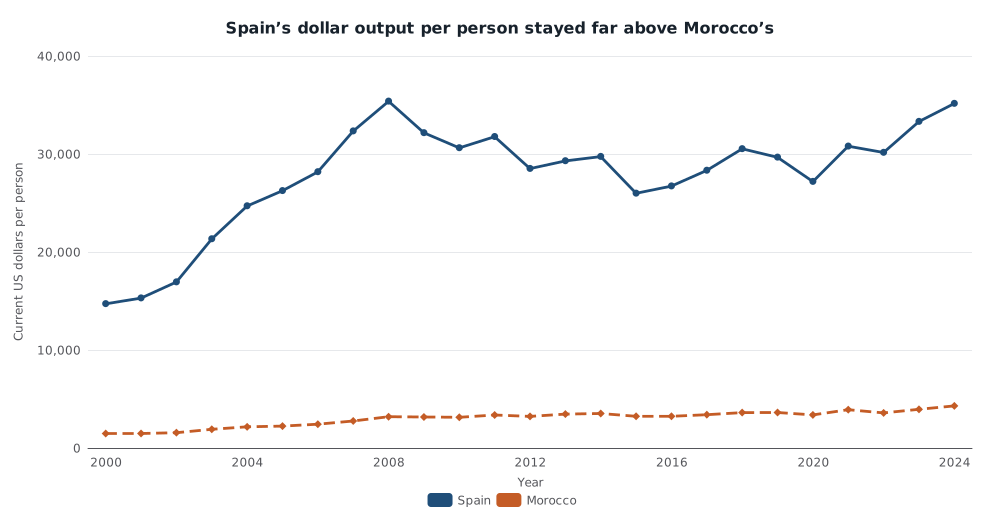
GDP per capita in current US dollars, Spain and Morocco, 2000–2024. IMF World Economic Outlook series NGDPDPC. 2025–26 IMF estimates are omitted. Output per resident is not a migrant wage.
The dollar gap stopped shrinking
Morocco is not standing still. In the IMF’s constant-price purchasing-power measure, output per person in Morocco rose 84.2 percent between 2000 and 2024, against 21.0 percent in Spain. The Spain-to-Morocco ratio on that volume measure fell from 7.7 times to 5.1 times.
Catch-up shows up in the dollar accounts too, but only early in the period. Spain’s current-dollar GDP per capita was 10.0 times Morocco’s in 2000 and 9.8 times in 2010. By 2019 the ratio was 8.2. In 2024 it was still 8.2. The compression of the 2010s did not continue.
Purchasing-power comparisons, which adjust for the fact that a dollar buys more in Morocco than in Spain, leave a smaller but still wide gap. In 2024 the IMF’s current international-dollar GDP per capita was $54,675 in Spain and $10,794 in Morocco — about 5.1 times. Readers need to pick the country in the chart; the 2024 points agree with this snapshot.
| Year | Spain, current $ | Morocco, current $ | Dollar ratio | Spain unemployment, % | Morocco unemployment, % |
|---|---|---|---|---|---|
| 2000 | 14,714 | 1,477 | 10.0 | 13.9 | 13.4 |
| 2010 | 30,624 | 3,135 | 9.8 | 19.9 | 9.1 |
| 2013 | 29,297 | 3,464 | 8.5 | 26.1 | 9.2 |
| 2019 | 29,664 | 3,623 | 8.2 | 14.1 | 9.2 |
| 2024 | 35,151 | 4,298 | 8.2 | 11.3 | 13.3 |
IMF World Economic Outlook, current US dollars per person (NGDPDPC) and unemployment rates (LUR). Dollar figures rounded to the nearest dollar; rates to one decimal place. Unemployment is reported on national definitions and is not a strictly harmonized comparison.
Spain had the higher jobless rate for 15 years
If the rush were a story about a jobless south and a tight Spanish labour market, the unemployment rates would show it. They do not.
In 2024 Morocco’s rate was 13.3 percent and Spain’s was 11.3 percent — close, with Morocco a little higher. That ordering is new. From 2008 through 2022, Spain’s rate was higher in every year. It peaked at 26.1 percent in 2013, when Morocco’s rate was 9.2 percent and Spain still produced 8.5 times as much dollar output per person. Morocco’s rate moved back above Spain’s only in 2023, for the first time since 2007.
Since 2019 the two series have actually crossed from opposite directions. Spain’s unemployment fell from 14.1 percent to 11.3 percent. Morocco’s rose from 9.2 percent to 13.3 percent. The income ratio did not move.
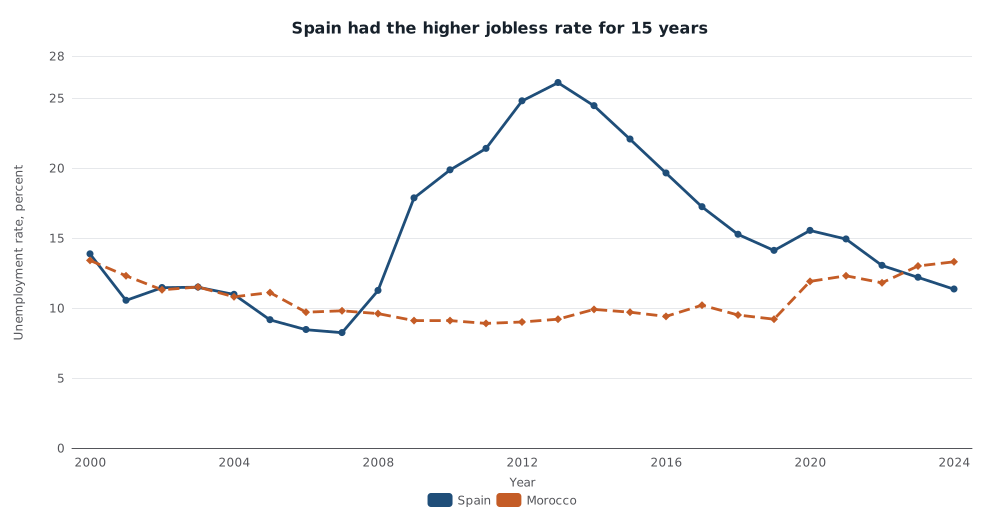
Unemployment as a percent of the labour force, 2000–2024, IMF World Economic Outlook series LUR. National definitions differ. Spain’s rate exceeded Morocco’s every year from 2008 through 2022.
None of this says jobs are easy to find on either side of the fence, or that youth unemployment — which these series do not separate — is similar. It does say that a headline jobs gap cannot carry the weight often loaded onto it. The income gradient was already steep through the years when Spain, not Morocco, posted the higher jobless rate.
North Africa is a cluster. Spain is not.
The same 2024 dollar measure puts Tunisia at $4,181 per person and Algeria at $5,772. Morocco sits in that North African band, not on a European slope. Senegal is $1,759 and Mali $1,093. Spain is about 20 times Senegal and 32 times Mali on this measure.
Those last two figures are not a census of who reached Ceuta. Reporting did not identify nationalities in a way this research can check, and some people who reach the enclave have transited from farther south. The comparison is a lower and upper bound on the gradient, not a passenger list: even relative to Morocco, Spain is an eightfold dollar cliff; relative to poorer Sahel economies the multiple is much larger.
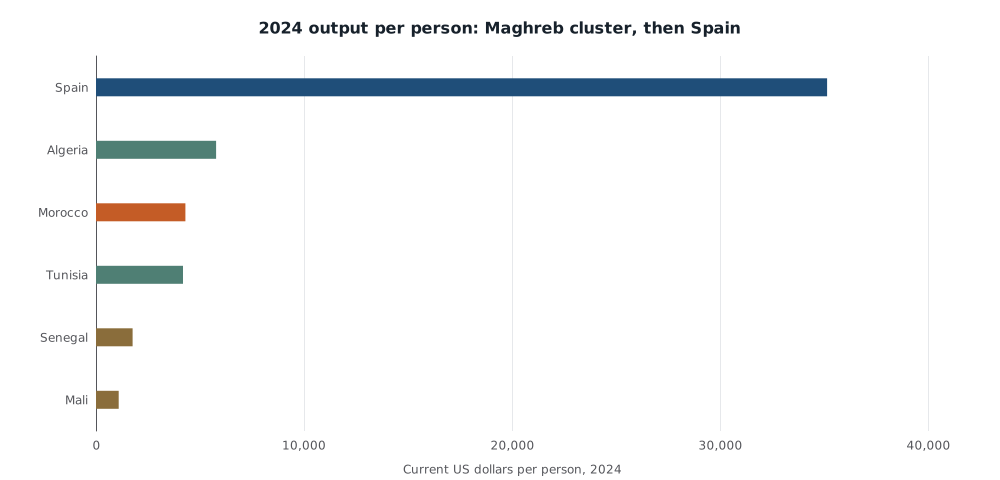
GDP per capita in current US dollars, 2024, IMF World Economic Outlook series NGDPDPC. Mali and Senegal are poorer West African comparators, not identified origins of the 2026 crossing.
IMF figures for 2025, which in this snapshot are estimates rather than settled outcomes, still show a dollar ratio of about 7.9, with unemployment around 10.5 percent in Spain and 13.0 percent in Morocco. The 2026 values are projections and are not used as facts here.
A barrier does not move the cliff.
A 500-metre sea wall can change how a crossing plays out at a breakwater. It cannot change the fact that Spain’s dollar output per person is still about eight times Morocco’s, as it was in 2019, and that this gap survived a decade in which Spain’s unemployment was far higher than Morocco’s.
The Ceuta surge was a short, deadly rush, not a measured labour-market flow. That does not make the income gradient irrelevant. It is why a crowd the size of a small city can still move toward a fence, and why more concrete is a response to the crossing rather than to the underlying arithmetic.
Sources and methods
This is retrospective research, written on 10 September 2026 about events reported on 1 August 2026. Crossing counts and deaths come from contemporaneous reporting, not from the IMF, and were not independently verified here. Macroeconomic figures are from the IMF World Economic Outlook in the pinned snapshot dated 24 August 2026 (source raw run 10 August 2026). Years 2000–2024 are treated as the historical series in that vintage; 2025–26 are IMF estimates or projections. GDP per capita is output per resident, in current US dollars unless labelled as purchasing-power figures. Unemployment rates follow national definitions and are not strictly comparable across countries. Live MacroVedia pages were checked for Spain and Morocco on the cited years; readers must select the country, and later vintages may revise the numbers. SVG rendering is not a substitute for browser or mobile layout review.
Research Date
The displayed date matches the related news edition. Research was completed 2026-09-10.
Related news: Daily · 2026-08-01
More Research
Airline Jobs Have Not Collapsed. The Bill Is In The Wage.
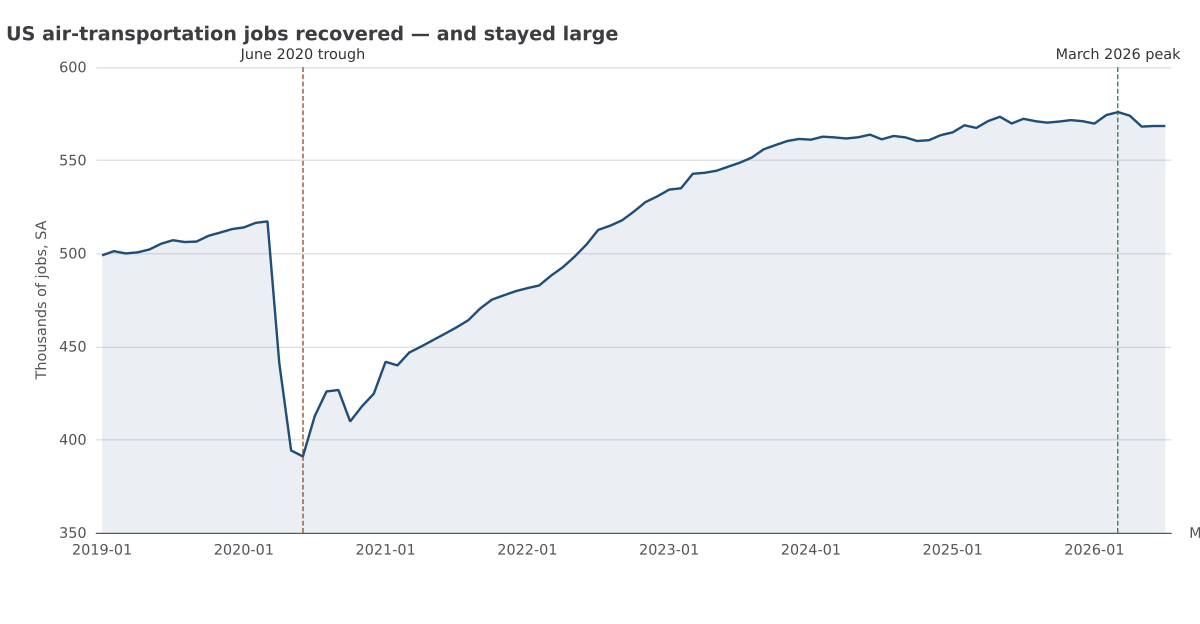
US air-transportation jobs in mid-2026 were still well above 2019. The cost pressure is in wages and hours, not a 2020-style payroll collapse.
Three Million Unemployed Is Not Germany’s Old Jobs Crisis
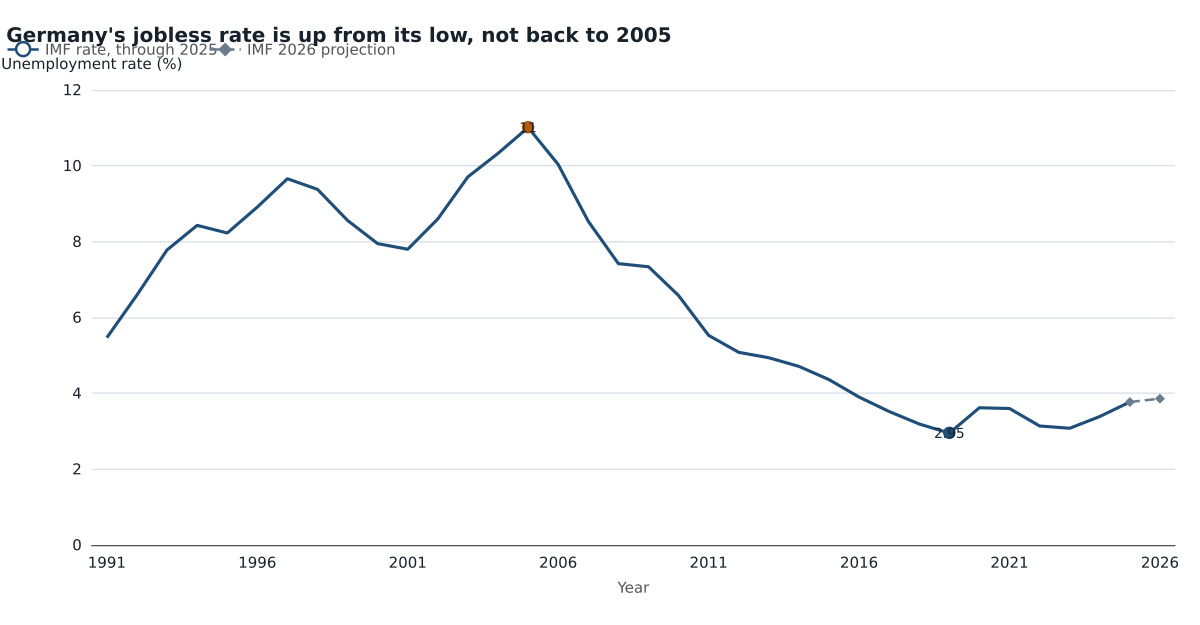
Germany’s IMF unemployment rate rose to 3.8 percent in 2025 from a 2.95 percent low in 2019, still far below the 11 percent peak of 2005, while employment stayed near 42.5 million.
Europe’s Oil Shock Is Back. Its Inflation Crisis Is Not.
IMF annual inflation in Germany, France, Italy and Spain has not returned to 2022. A 3 percent print is a rebound, not a second energy-crisis peak.